Dividend Growth Investing & Retirement is supported by its readers through donations and affiliate links. If you purchase through a link on my site, I may earn a commission. Thanks! Learn more.

A question I often get asked is how do I decide what stocks to buy? The answer isn’t a simple one, but I’ll do my best to break it down. My process involves reviewing various companies and setting target prices. My dividend growth investing criteria is broken into two parts. First I complete a dividend stock analysis to determine if it is a company worth owning. What makes a company worth owning? Well I’m a long term investor so I’m looking for companies with a competitive advantage that have a history of increasing their dividends and earnings. I also want reasonable debt levels and a sustainable dividend among other things.
If after I’ve completed a dividend stock analysis and I decide that I’d like to own the company I perform various valuation tests to come up with a reasonably cheap target price. Then I wait… and wait. My target prices are usually based on various measures that in the past would have resulted in opportunities to buy shares in 2 or 3 years over the past decade. This is a fairly conservative approach which suits my investment style, but involves waiting around for prices to drop below my target price.
⭐ Find dividend growth stocks that have survived multiple recessions and increased dividends for 5, 10, 25+ years in a row.
So by now you should have a general idea of how I decide to purchase stocks, but I want to get into specifics. I look at 9 different areas when I complete a dividend stock analysis:
- Company Description
- 10 Year Stock Chart
- Revenue and Earnings
- Dividends
- Dividend Sustainability
- Payout Ratio
- Estimated Future Earnings
- Competitive Advantage & Return on Equity
- Debt
- Shares Outstanding
- Valuation
- Dividend Yield
- Graham Price
- Price to Earnings Ratio (P/E)
- Price to Book Ratio (P/B)
- Price to Sales Ratio (P/S)
- Price to Cash Flow Ratio (P/CF)
These 9 categories are all important, some more than others. I’m going to go through all of them in detail so that you can get a real understanding of my dividend growth requirements. This post is quite long, so feel free to jump around from one section to another. I’ve put in examples of charts and graphs that I look so that you can get a proper idea of what I look at.
Company Description
It’s important to understand how the business makes money. If you don’t understand how the business operates or you find it confusing you should not invest in it. Either take the time to learn more about the company or choose a different company. One of the first things I do is take a look at the company description either on the company website or on Yahoo! Finance or Google Finance. From this I’ll be able to read a few paragraphs about what the company does. I’ve been looking at the same companies for a long time so I have a fairly good idea of what each company does and how they make their money. If it’s a new company I haven’t reviewed before then you’ll have to dig a little deeper to get a better understanding of the company. See if you can find other reviews of the company, read the annual reports, etc.
A test I use sometimes is seeing if I can describe how the company makes its money in one sentence. It is hard to explain something you don’t fully understand in a full and concise sentence. This test also helps weed out the complicated companies. I don’t want to invest in a company that has a complicated way of making money because I won’t be able to recognize when it’s in trouble or doing well. I want to be able to monitor a company after I invest in it, so the more I understand the better. Being able to explain how a company makes its money in one sentence is a quick test to see if I know what I’m talking about.
10 Year Stock Chart
I look at the 10 year stock chart to see if there were any big drops or increases and what caused them. This gives me a bit of insight as to how the stock market reacted to different events. I’ll often use Google Finance and put the news events on. This way I can see what was going on at certain points in the past 10 years. If similar events happen in the future I have an idea of how the market will react. 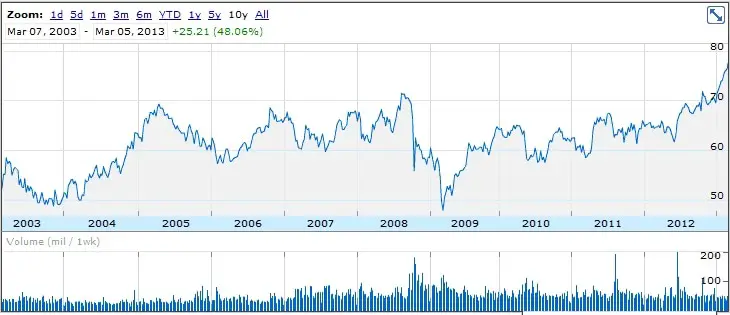 I also calculate the 10 year annual average return for capital appreciation and dividends. I like to see how much of the returns were from dividends versus capital appreciation. I don’t know much about trend analysis so I don’t really look at the 10 year chart for trends. For anything trend related I use INO`s Free Trend Analysis or their Top 50 Trending Stocks.
Revenue and Earnings
When I invest in dividend growth companies, I am looking for a sustainable dividend growth rate of 8% or more. For the dividend to be sustainable the company also needs to increase earnings by over 8%. I want to see Earnings Per Share (EPS) growth above 8%, but it’s also important to look at revenue per share growth. In cases where the EPS growth has increased more than revenue per share growth the company has become more efficient and found ways to save money or cut costs. While this is a good thing, a company can only become so efficient before it has to rely on genuine revenue growth. Companies can’t cut costs forever. For this reason I also like to see revenue per share growth around 8% or higher.
Next, I look at revenue and net income growth, so that I can get an idea of where the growth is coming from. I like to get an idea if growth on a per share basis is coming from genuine growth or because the company has been buying back shares. For example if a company has reduced the number of shares outstanding EPS growth will be higher than net income growth. I like growth rates on a per share basis and a total basis higher than 8% so I know the company has a good ability to grow.
I like to compare the 10 year rates in a table like the following. Ideally I’m looking for 8% or higher in all categories. This is quite a difficult measure to beat, so I do allow some flexibility with this criterion. These figures are based on past information, so if the company is expected to grow a lot in the future then I may choose to focus less on this set of criteria. 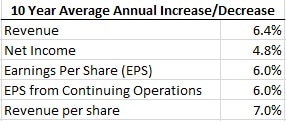 It’s also important to look at the year over year trend. I like companies that consistently make more and more money. I look at the revenue and net income in a chart and also revenue and earnings on a per share basis in another chart. These charts help me easily see different trends.
 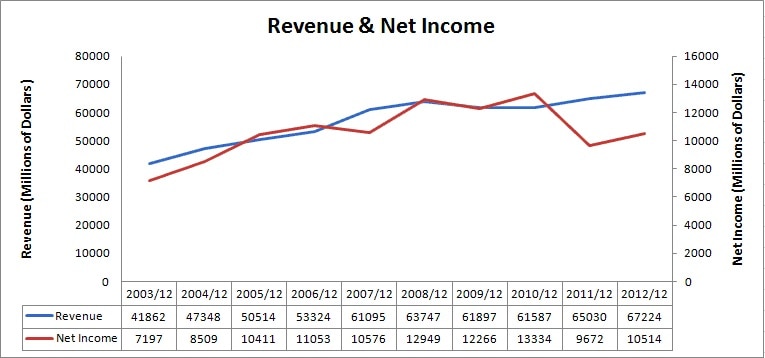 I like to invest in companies that have a history of increasing earnings year after year. I like to see revenue and net income steadily increasing over time. I will allow the odd blip, but I don’t like to see erratic earnings. I like companies that make more and more money over time, and do not have losses.
Similar to the previous chart I’m looking for a consistent trend upwards. 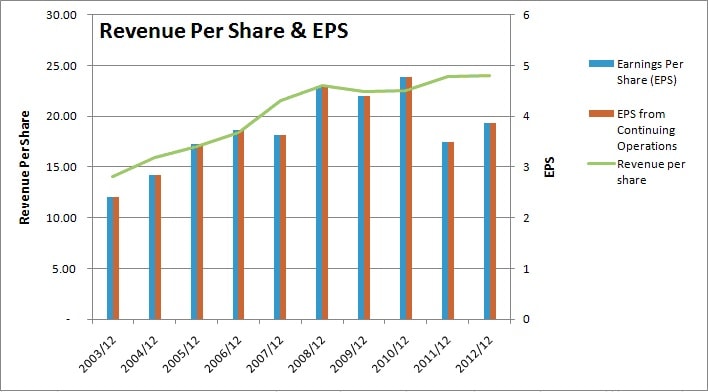 Dividends
I like to invest in companies that have a history of consistently increasing their dividends. First I look at the past 10 years of dividends. I do not want to see any dividend cuts. 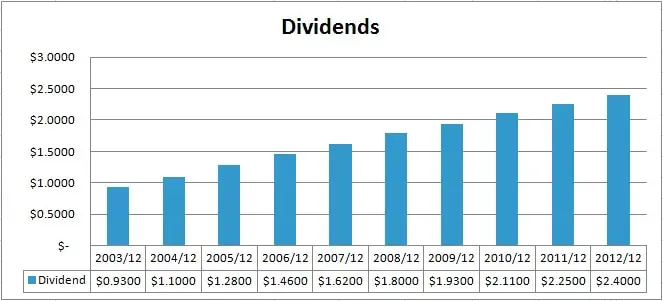 I want to see a steady increase in dividends each year. If the company is Canadian I’m a little more flexible. There are a lot less companies in Canada, so if a company has not increased its dividend in one of the years but kept it the same then I’ll still consider it. If there have been dividend cuts in the past 10 years I generally won’t invest in the company. If the company is a US company then I generally want to see 10 or more years of annual dividend increases. For US company dividend streaks I use David Fish’s list and for Canadian dividend streaks I use the Canadian Dividend All-Star List.
Next I take a look at the dividend growth rates comparing the 1, 3, 5 and 10 year rates in a table like the following: 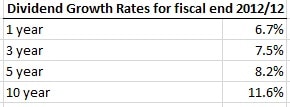 I am generally looking for growth rates of 8% or more. Past dividend growth rates cannot always be relied upon to estimate future dividend growth rates, but they are usually a good indicator. If a company has strong dividend growth history and earnings are growing, I generally expect dividend growth rates under 8% to remain around the same. Rates over 8% I expect to come down over time.
I like to compare the EPS growth over the past 10 years to the 10 year growth rate to see if dividends have been growing faster than earnings. If the dividend has been growing faster than earnings, I would expect dividend growth to slow in future years. A dividend growth rate consistently above EPS growth is unsustainable. If dividend growth is higher than earnings, I want to see a lower payout ratio so that the dividend is sustainable. 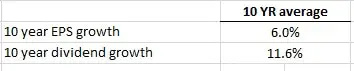 Dividend Sustainability
When looking at the sustainability of dividends, I like to focus on two areas: the payout ratio and estimated future earnings.
1. Payout Ratio
The payout ratio is calculated as dividends per share divided by EPS. The idea is to have a company pay for its dividend with the earnings it brings in and still have some left over for growth. I like to see a payout ratio of less than 60% as this allows for some future dividend growth, while still allowing the company to use some of its earnings to fund company growth. For utilities and telecoms I’ll allow a slightly higher ratio. I like looking at a graph of the past 10 years worth of payout ratios. 
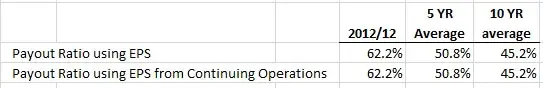 I also like to look at the 5 and 10 year average payout ratio and compare it to the current year to make a guess at future dividend growth. In the example above the payout ratio is currently above the 5 and 10 year averages which suggest future dividend growth will slow.
2. Estimated Future Earnings
It’s important to look to the future as well as to the past. I’m generally looking for companies with an 8% dividend growth rate. In order for a company to sustain this level of dividend growth I want to see that their estimated earnings are above 8%. It’s best to take these estimates with a grain of salt as a lot can happen in 5 years, and the further away the estimate the less accurate it gets.
Using the EPS growth rate I run the numbers to see if I can come up an estimated dividend growth rate. I use the 5 and 10 year payout ratio averages as well as a best guess to come up with a few different growth rates. This will give me an idea of the type of dividend growth I can expect. Sometimes the company will state in their dividend policy their target payout ratio. In cases like this I’d use that number for the best guess, otherwise it is really just a guess based on my knowledge of the company.
You can see from my calculations below that I take the most recent fiscal year end EPS and the 5 year EPS estimated growth rate to determine the estimated EPS in 5 years. Once I have the EPS in 5 years I use the different payout ratio averages and best guess to estimate various dividend amounts in 5 years. I compare these estimated dividends in 5 years to the most recent fiscal end dividend to come up with an estimated dividend growth rate. I find this particular exercise very useful when looking for dividend growth candidates with a 8% dividend growth rate or higher. 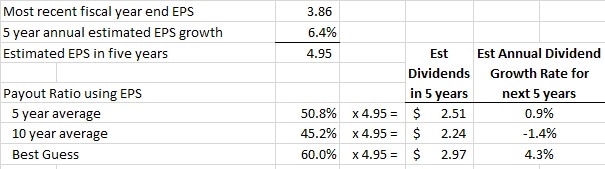 Competitive Advantage & Return on Equity (ROE)
I like to invest in companies with a sustainable competitive advantage. These companies can earn more money and generally do better than their competitors. I like to use ROE to help determine the competitive advantage of a company compared to its peers. ROE measures a company’s profitability by revealing how much profit a company generates with the money shareholders have invested. The ROE will vary widely from industry to industry, but by comparing a company’s ROE to the industry ROE you can get an idea if the company has a competitive advantage that allows it to perform more efficiently than its competitors.
Generally I’ll look at companies with a ROE higher than 12%, but I prefer it to be around 20% or higher. Depending on the industry I’ll occasionally stray beyond my guidelines. Rather than pick a specific ROE number to target, focus on a ROE higher than the industry average. It’s also important to see a stable ROE over time without any big spikes down. I like to see a stable or growing ROE that is above the industry average. This type of trend shows me the company has been able to consistently perform more efficiently than its competitors. This suggests a competitive advantage. I like to look at a chart like the one below to identify trends. In the example below I can see that the ROE has been declining which is not a good sign.  The ROE can vary from year to year, so it can be useful to compare the 5 and 10 year averages to the current ROE and industry average. In the example below I used a chart of Johnson & Johnson which I reviewed in a previous post. Ideally what you want to see is that the current ROE is in line or higher than the 5 year, 10 year and industry averages. When I reviewed JNJ this was not the case.
 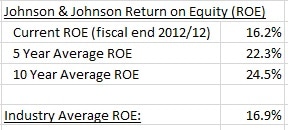 Debt & Liquidity
I want to invest in companies that are fiscally responsible, so it is important to look at debt levels and see that they are at reasonable levels. 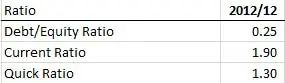 I like to see a Debt/Equity ratio below 1, and a current ratio and quick ratio above 1. These are general guidelines and can vary by industry.
Shares Outstanding
I don’t place too much importance on share buybacks in my analysis. Given the choice I’d rather have a company increase its dividend versus buying back shares, but often the companies I look at are doing both. A decreasing number of shares outstanding is a good thing, but I like to see smart share buyback programs. That is I like to see a company buying back its shares when they are priced low, rather than just buying back for the sake of buying back.  Valuation
There is a misconception out there that dividend investors only care about the dividend and don’t worry about the stock price. I can’t speak for everyone, but this certainly isn’t the case for me. I believe it’s important to purchase stocks at a reasonable to cheap price. This helps preserve your capital and will generally result in better returns. Rather than rely on just one method I like to use a variety of different methods. Using this approach allows me better identify reasonable targets. I find that one measure could point to a cheap price, but another measure may not. For instance the P/E may point to a cheap price, but the P/Book may point to an expensive stock. By using a variety of different test you get a better idea if something is truly value priced.
I use the lowest price for the fiscal years to determine the 5 year, 10 year and 2008-2011 averages. Investors commonly use 5 and 10 year averages, but I like to include the fiscal 2008 to 2011 low price average, as I feel that the low prices during this era represent a reasonably low stock price. During 2008 and 2009 most companies experienced a really low price due to the Global Financial Crisis followed by increases in 2010 and 2011.
I use 6 main ratios to determine a fair price: Yield, Discount/Premium of the low price compared to the Graham Price, P/E, P/B, P/Sales and P/Cash flow. I like to look at both EPS and EPS from continuing operations so it ends up being a total of 8 ratios as the Graham Price an P/E both use EPS.
My low price averages would look something like this: 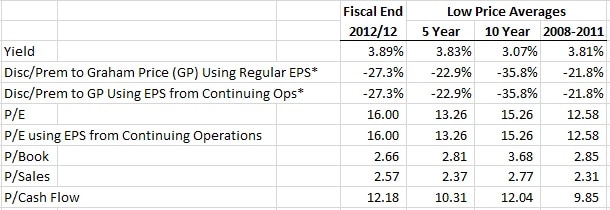 * Calculation Notes: I compare the low price to the calculated Graham Price (GP) to determine the discount or premium to GP. I calculate the GP using the square root of (22.5 x Book Value x EPS). For EPS in this formula I use the lesser of the 3 year EPS average or the current EPS. If the GP calculated is negative then I set the Discount/Premium to GP as -25%. The other ratios are calculated in the normal fashion.
The majority of my valuation methods use historical averages, so it is important that you expect the company to continue to operate in a similar manner to its past. If you expect the company to change, these valuations become less useful.
Now that I have these different averages, I can use them to determine a target price. Using these averages will create a lot of different target prices, so I like to compare this strategy to previous years. Ideally what I’m looking for is a strategy that would have given me a chance to buy the stock in two to three fiscal years in the past 10 fiscal years. It’s not always possible to test my strategy back 10 years, due to limited financial information, but I do my best.
I go through the information and highlight my conservative target prices and come up with an average. 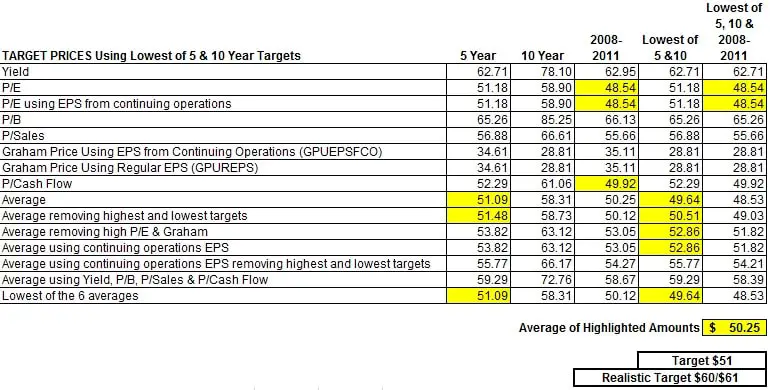 I would say that this strategy is quite conservative and as a result I don’t buy stocks very often. I’m usually waiting around for a few months before I’m able to buy something. This is fine by me as I’m young, so I’ve got the time and it pays to be patient. Sometimes my target price is too conservative, so much so, that occasionally I have to revise my target up. I like to use the yield as a way to gauge if my targets are realistic or not. For instance if my target price would result in a dividend yield that has never been paid by the company, then odds are the price isn’t going to come down that low. In these cases I adjust my target to a more realistic value. In rare instances I’ll adjust my target down further.
Before I buy a stock I like to look at Morningstar’s 5 star rating as a quick way of seeing what others think of the stock. If a stock has a 4 or 5 star rating then they consider the stock to be trading at discount to fair value. A 1 or 2 star rating indicates a premium to fair value and a 3 out of 5 rating suggests the price is close to fair value.
I also like to look at INO`s Free Trend Analysis prior to investing to see if I should hold off or not. Sometimes it is nice to see if the stock is trending down or up before buying it. You can signup by using the form below:
Conclusion
After I’ve reviewed all these different measures I analyse them as a whole and decide if the company is a company I’d consider investing in. If it is I add my target price to my dividend watch list and wait until the price drops to buy shares.
Newsletter Sign-Up & Bonus
Have you enjoyed our content?
Then subscribe to our newsletter and you'll be emailed more great content from Dividend Growth Investing & Retirement (DGI&R).
BONUS: Subscribe today and you'll be emailed the most recent version of the Canadian Dividend All-Star List (CDASL).
The CDASL is an excel spreadsheet with an abundance of useful dividend screening information on Canadian companies that have increased their dividend for five or more years in a row.
The CDASL is one of the most popular resources that DGI&R offers so don't miss out!


Thank you for your great work! I’ll definitely link to your blog from mine. You have put a great deal of effort into it and it shows. I like your approach which ressembles the Warren Buffett approach of value investing. I also like the all star dividend list. It’s gonna simplify my task of putting a prospect stock list together.
Thank you for sharing knowledge
“A dividend growth rate consistently above EPS growth is unsustainable. If dividend growth is higher than earnings, I want to see a lower payout ratio so that the dividend is sustainable.”
I am curious as to why you want to rely on EPS instead of CFPS. I spent the last 10 years of my working career in one of the Big 5 Cdn banks in the special loans workout area for large corporates on both sides of the border and cash was king. There has been lots of evidence demonstrating the inapplicability of relying on net earnings because of how it can be arrived at and could be manipulated – Nortel and Enron were prime examples. I have a few older excellent articles on EBITDA that effectively speak to this and would be happy to share them with you if you are interested.
I noticed a comment on your site that you are not all that familiar with “trend analysis” so go to the Chartschool tab of http://www.stockcharts.com and search for it. Lots of info and you will, as an accountant, pick up the process quickly. There is also a Webinar tab – look for Greg Shnell, amongst others, he does a Commodities Countdown as well The Canadian Technician. A lot of free information.
You have a great website, thank you. I can combine its fundamentals with technical analysis.