Dividend Growth Investing & Retirement is supported by its readers through donations and affiliate links. If you purchase through a link on my site, I may earn a commission. Thanks! Learn more.

These dividend stock analyses can be difficult to understand if you don’t have an understanding on dividend growth investing. If you find that some of this information doesn’t make sense read my article on Deciding Which Stocks To Buy: Dividend Growth Investing Criteria first. This article will give you an understanding of why I look at various measures and what I’m looking for in a company when I do a dividend stock analysis. And now onto Rogers Communications…
Company Description
⭐ Find dividend growth stocks that have survived multiple recessions and increased dividends for 5, 10, 25+ years in a row.
Here is the business summary from MorningStar:
Rogers Communications is a diversified communications and media company. It is Canada’s largest wireless voice and data communications services provider. Its cable and telecom division is Canada’s largest cable television provider, offering cable TV, high-speed Internet access, telephony services, and video retailing. The business solutions division is a national provider of voice communications services, data networking, and broadband Internet connectivity to businesses.
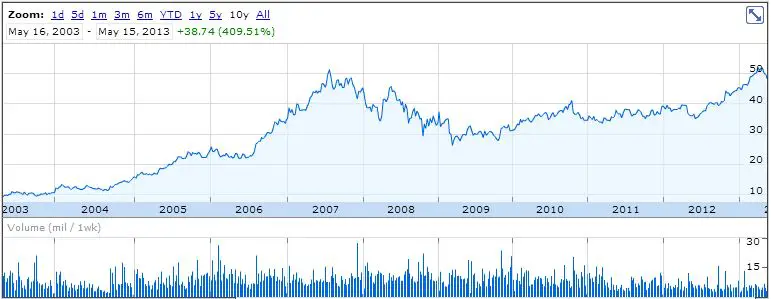
10 Year Stock Chart
Looking at the 10 year stock chart, there is a 10 year annual average return of 17.7%. If we include the dividend payments over the past 10 fiscal years (Total dividends paid of $7.10) then the total average annual return would be 19.3% with the average return from dividends representing 1.6%.
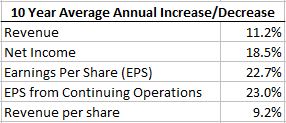
Revenue & Earnings
Roger’s has been able to grow its earnings and revenue at impressive rates over the past 10 years. All categories are above the 8% I like to see.
If we look at the revenue and net income chart below it shows a nice trend up, however there were two years of net losses in 2004 and 2005. The company hasn’t lost money since then, and has grown net income considerably.
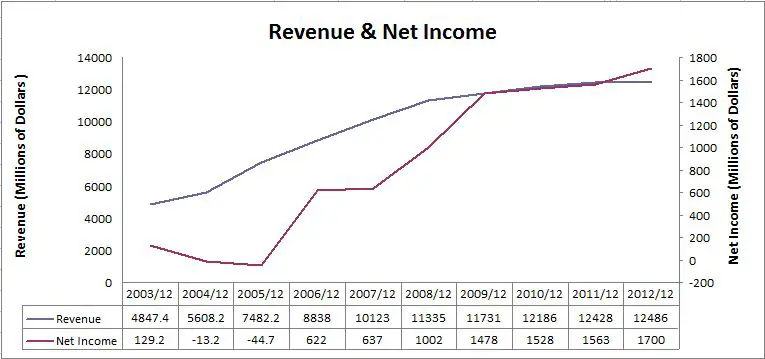
The upward trend in this chart is appealing. When the same ratios are examined on a per share basis they show an equally impressive upward trend.
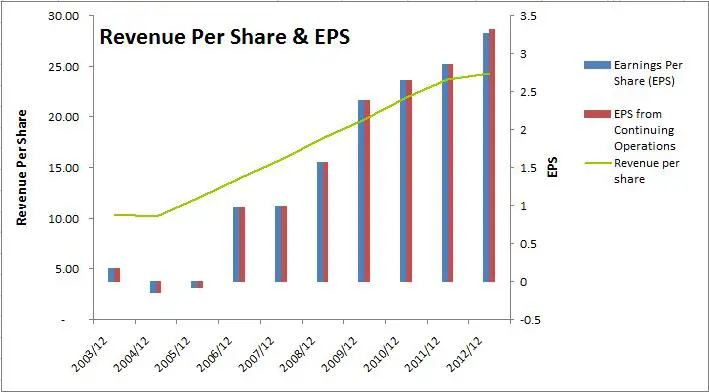
After 2004 and 2005 Rogers Communications has been able to grow revenue and EPS considerably year after year. I don’t like to see a company losing money which it did in 2004 and 2005, but overall Rogers shows a strong ability to grow earnings.
Dividends
A quick look at the Canadian Dividend All-Star List tells me that Rogers Communications has increased their dividend for 8 consecutive calendar years in a row. For a Canadian company this is an impressive streak. If they can continue to pay out their dividend for the remainder of the year; which I expect them to, then this will mark 9 consecutive years of increasing dividends.

Dividends have been steadily increasing at a good pace.
Dividend Growth
The most recent quarterly dividend increase occurred with the dividend recorded in March 2013. It increased by 10.1% from $0.3950 to $0.4350.
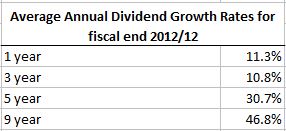
I’ve used the 9 year average annual dividend growth rate instead of the 10 year rate because no dividends were paid in 2002. I’ve said before that past dividend growth rates can be used to predict future rates, but the 5 and 9 year rates are very high and a similar rate going forward would not be sustainable. I’d expect a lower average annual growth rate, closer to the 1 or 3 year average annual rates.
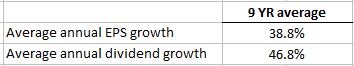
When EPS growth is compared to dividend growth you can see that dividends have been growing at a faster rate than EPS which is not sustainable.
Dividend Sustainability
To get a better idea of the dividend growth going forward I look at past payout ratios and the estimated future earnings.
- Payout Ratio
Rogers Communications payout ratio at the most recent fiscal year end was 48.5%. For most companies a payout ratio of 60% or less is good, but some industries like the cable/telecom industry typically have higher payout ratios (60-80%).
When I look at the competitions payout ratio at their most recent fiscal year ends Rogers Communications looks in good shape. It has the lowest among its main competitors TELUS, BCE and Shaw Communications. The competition had payout ratios ranging from Shaw Communications 58.7% to BCE’s 65.5%. TELUS had a payout ratio of 60.2%.
Just because Rogers has the lowest payout ratio doesn’t necessarily mean that its dividend will grow the most however. If we look at the chart below a trend emerges over the past few years.
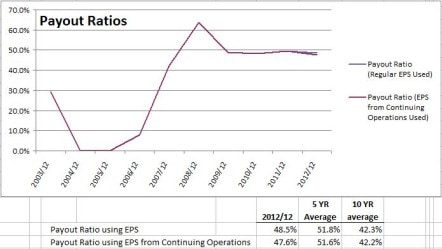
The payout ratio for the past 5 years is usually around 50%-60%. 2004 and 2005 had negative earnings and the payout ratio is shown as 0 which is throwing off the 10 year average, so the 5 year average is a better indication. I’d guess that Rogers Communications will try and maintain a similar level to its 5 year average (50% – 60%) going forward.
- Estimated Future Earnings
Analysts are currently estimating that Rogers Communications will grow it’s EPS at 4.4% annually for the next 5 years. It’s best to take these estimates with a grain of salt as a lot can happen in 5 years, and the further away the estimate the less accurate it gets. That said, analyst estimates can still be useful when trying to guess future dividend growth rates (The key word being guess).

Based on Rogers Communications previous payout ratios and the estimated future earnings I’d expect them to continue to raise its dividend annually at a rate around 5.1% to 9.0%. Based on the past few years of dividend growth at around 10% I’d expect the dividend growth to be at the higher end of this range. If Rogers Communications decides to increase its target payout ratio I can see dividend growth exceeding my expectations.
Competitive Advantage & Return on Equity (ROE)
The chart below show’s a strong upward trend in ROE, however it isn’t until 2008 that Rogers Communications gets beyond the 20% mark that I typically like to see.
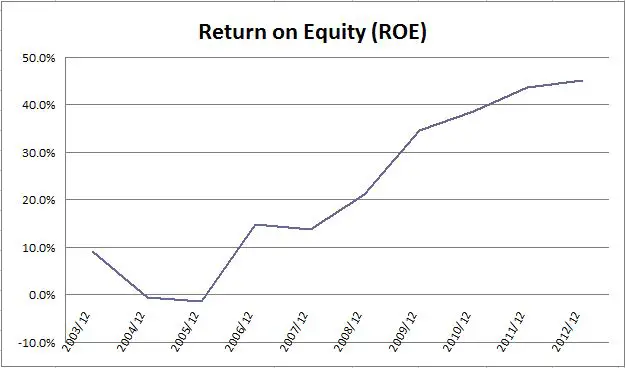
The communications industry in Canada is dominated by a few key players: Rogers Communications, TELUS, BCE and Shaw Communications. If we look at the competition’s ROE and compare it to Rogers Communications it is easy to see that Rogers Communications is doing very well.
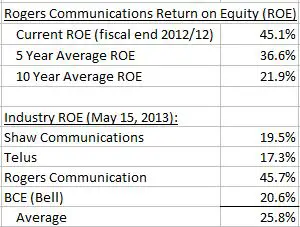
Rogers Communications ROE is more than double that of the competitions. Keep in mind that a ROE of 45% is very high, and I’d don’t expect these levels to continue. I expect ROE to drop down to something closer to the 5 or 10 year averages, which are still very impressive. A ROE consistently above the competitions suggests that a competitive advantage exists. While this suggests a current competitive advantage I don’t think Rogers will be able to hold on to this advantage over the long term. The competition in this industry is too fierce to have one company hold a competitive advantage for a long time. I think in the near term Rogers Communication holds an edge on the competition largely because they have the first and largest LTE 4G network. While this will benefit Rogers Communication in the short term I don’t expect this advantage to last for a long time as the competition will soon have their own 4G networks.
Debt & Liquidity
Normally I like to see a current and quick ratio above 1.0 and a debt to equity ratio less than 1.0. In this industry it is typical for companies to take on more debt however. If we look at the 10 year history we can see that the current and quick ratios are roughly in line with the past. The debt to equity ratio has crept up over the past few years to almost 3, which is a trend I’d like to see reversed.
![]()
Overall I would say that debt levels are OK, but not great.
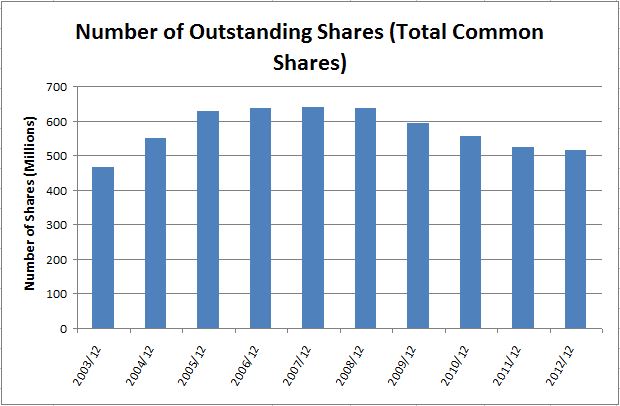
Shares Outstanding
Shares outstanding have been coming down since 2008 which is a nice trend, but if we look at the whole 10 years, shares outstanding grew annually at an average rate of 1.8%. Overall there isn’t anything too exciting to see in this chart.
Valuation
I use 6 main ratios to determine a fair price: Yield, Discount/Premium of the low price compared to the Graham Price, P/E, P/B, P/Sales and P/Cash flow. I like to look at both EPS and EPS from continuing operations so it ends up being a total of 8 ratios as the Graham Price an P/E both use EPS.
I use the lowest price for the fiscal years to determine the 5 year, 10 year and 2008-2011 averages. Investors commonly use 5 and 10 year averages, but I like to include the fiscal 2008 to 2011 low price average, as I feel that the low prices during this era represent a reasonably low stock price. During 2008 and 2009 most companies experienced a really low price due to the Global Financial Crisis followed by increases in 2010 and 2011.
I get the following for Rogers Communications.
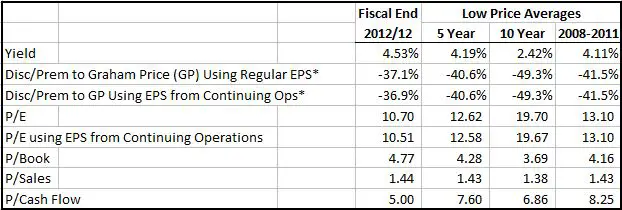
*Calculation Notes: I compare the low price to the calculated Graham Price (GP) to determine the discount or premium to GP. I calculate the GP using the square root of (22.5 x Book Value x EPS*). For EPS in this formula I use the lesser of the 3 year EPS average or the current EPS. If the GP calculated is negative then I set the Discount/Premium to GP as -25%. The other ratios are calculated in the normal fashion.
The majority of my valuation methods use historical averages, so it is important that you expect the company to continue to operate in a similar manner to its past. If you expect the company to change, these valuations become less useful.
Now that I have these different averages, I can use them to determine a target price. Using these averages will create a lot of different target prices, so I like to compare this strategy to previous years. Ideally what I’m looking for is a strategy that would have given me a chance to buy the stock in two to three fiscal years in the past 10 fiscal years. It’s not always possible to test my strategy back 10 years, due to limited financial information, but I do my best.
In the below table I was able to highlight the target prices from strategies that would have given you a target price above the low price in 2 – 3 of the past 10 fiscal years. I’ve used the average of these to determine the target price of $38.
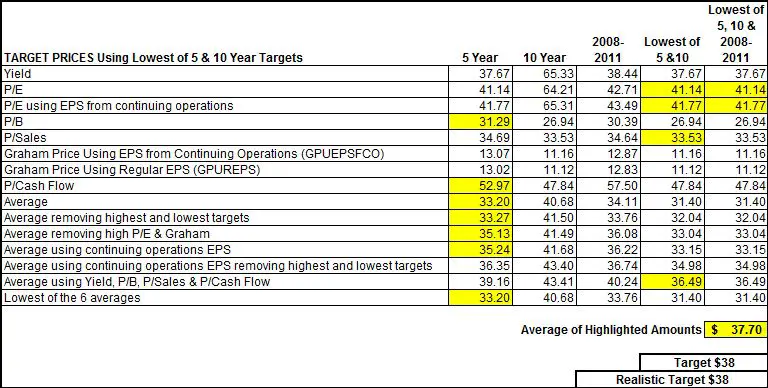
I would say that this strategy is quite conservative and as a result I don’t buy stocks very often. I’m usually waiting around for a few months before I’m able to buy something from my dividend watch-list. This is fine by me as I’m young, so I’ve got the time and it pays to be patient. Sometimes my target price is too conservative. So much so, that occasionally I have to revise my target up. I like to use the yield as a way to gauge if my targets are realistic or not. For instance if my target price would result in a dividend yield that has never been paid by the company, then odds are the price isn’t going to come down that low. In these cases I adjust my target to a more realistic value. In rare instances I’ll adjust my target down further. With a current quarterly dividend of $0.4350 the yield on $38 would be 4.58%. This is in line with the highest yields during the past 5 years, so I’ve kept the realistic target the same as the original.
Before I buy a stock I like to look at Morningstar’s 5 star rating as a quick way of seeing what others think of the stock. If a stock has a 4 or 5 star rating then they consider the stock to be trading at discount to fair value. A 1 or 2 star rating indicates a premium to fair value and a 3 out of 5 rating suggests the price is close to fair value. Rogers Communications is currently around $48, and Morningstar rates it 4 out of 5 stars.
Trend Analysis
I also like to look at INO`s Free Trend Analysis prior to investing to see if I should hold off or not. Sometimes it is nice to see if the stock is trending down or up before buying it. On May 16, 2013 INO showed a weak downtrend for Rogers Communications:
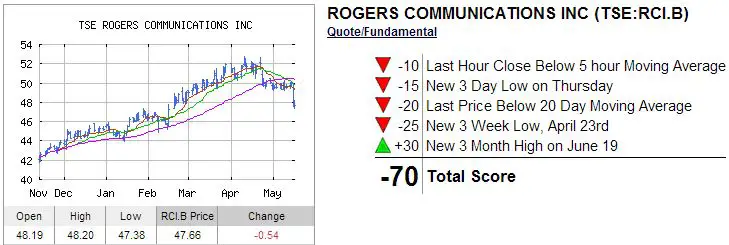
To see the most recent trend analysis for Rogers Communications click here. INO also has a list of the top 50 trending stocks and free trading seminars and videos.
Conclusion:
Rogers Communications had some troubles in the past that resulted in losses in 2004 and 2005. Since then the company has been able to improve on many fronts. Overall I like Rogers Communications and I’d consider investing in the company should the price drop below my target price of $38.
Rogers Communications has been able to increase their dividend at a good pace and I expect them to continue this trend. I expect future dividend growth to be in the range of 5.1% to 9.0%, likely at the higher end of this range which would be on pace with their more recent annual dividend increases around 10%. I see Rogers Communications as a good dividend growth candidate, but if you are looking for dividend growth TELUS is a more certain option. TELUS has stated that for the next three years it plans on increasing its dividend at average annual increases of roughly 10% and keeping its payout ratio around 65-75%. While Rogers Communications offers good dividend growth potential, it is harder to predict as they haven’t made their dividend policy as well known as TELUS.
Disclaimer
I am a blogger and not a financial expert. These writings are my own opinions and should not be considered financial advice. Always perform your own due diligence before purchasing a stock. I mention target prices in this article, but this is not a recommendation to buy this stock, it is just a target price I use for my own personal investing that I have chosen to share.
Newsletter Sign-Up & Bonus
Have you enjoyed our content?
Then subscribe to our newsletter and you'll be emailed more great content from Dividend Growth Investing & Retirement (DGI&R).
BONUS: Subscribe today and you'll be emailed the most recent version of the Canadian Dividend All-Star List (CDASL).
The CDASL is an excel spreadsheet with an abundance of useful dividend screening information on Canadian companies that have increased their dividend for five or more years in a row.
The CDASL is one of the most popular resources that DGI&R offers so don't miss out!


Really appreciated following your detailed methodology here. I’m going to take some of these lessons myself, did you read security analysis by Ben Graham?
I’ve read part of it, but not the whole thing. I keep meaning to read the whole thing, but I haven’t had the time. If you haven’t already I’d read another article I wrote when I bought Roger’s as it is a bit more up to date: https://dividendgrowthinvestingandretirement.com/2014/10/portfolio-update-rogers-communications-purchased/. It’s not as in depth, but I’m not expecting as high of dividend growth anymore.