Dividend Growth Investing & Retirement is supported by its readers through donations and affiliate links. If you purchase through a link on my site, I may earn a commission. Thanks! Learn more.

The past few days I’ve written articles on how to identify undervalued dividend growth stocks by comparing current dividend yield to historic averages and how to find target prices quickly. Writing these two articles made me realize that Suncor Energy looked undervalued, so I decided to perform a dividend stock analysis to see if I should invest.
These dividend stock analyses can be difficult to understand if you don’t have an understanding on dividend growth investing. If you find that some of this information doesn’t make sense read my article on Deciding Which Stocks To Buy: Dividend Growth Investing Criteria first. This article will give you an understanding of why I look at various measures and what I’m looking for in a company. And now onto Suncor Energy…
⭐ Find dividend growth stocks that have survived multiple recessions and increased dividends for 5, 10, 25+ years in a row.
Company Description
Taken from Google Finance:
“Suncor Energy Inc. (Suncor) is an integrated energy company. The Company is focused on developing petroleum resource basins-Canada’s Athabasca oil sands. In addition, the Company explore for, acquire, develop, produce and market crude oil and natural gas in Canada and internationally, and the Company transports and refines crude oil, and market petroleum and petrochemical products primarily in Canada. The Company operates under three segments: Oil Sands, Exploration and Production, and Refining and Marketing. The Company also markets third-party petroleum products. The Company also conducts energy trading activities focused principally on the marketing and trading of crude oil, natural gas and byproducts.”
10 Year Stock Chart
The 10 year average annual return is 9.5%. If we include the dividend payments over the past 10 fiscal years (Total dividends paid of $2.50) then the total average annual return would be 10.3% with the average return from dividends representing 0.8% annually.
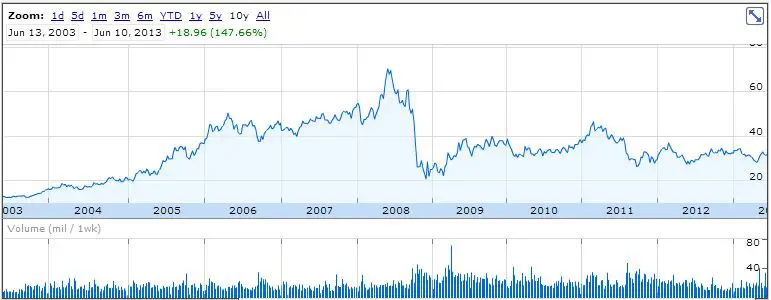
The stock chart looks good from 2003 to 2008 until it drops off. Suncor Energy is still well below its 2008 high, and hasn’t really been able to get close to it in the past 4 or 5 years. From a 10 year perspective the stock looks good coming in at a 9.5% average annual return.
Revenue and Earnings
Suncor Energy is an energy company that deals in oil and gas. With these types of companies I expect a certain amount of fluctuation when it comes to revenue and earnings. When I look at the charts that is exactly what you get.
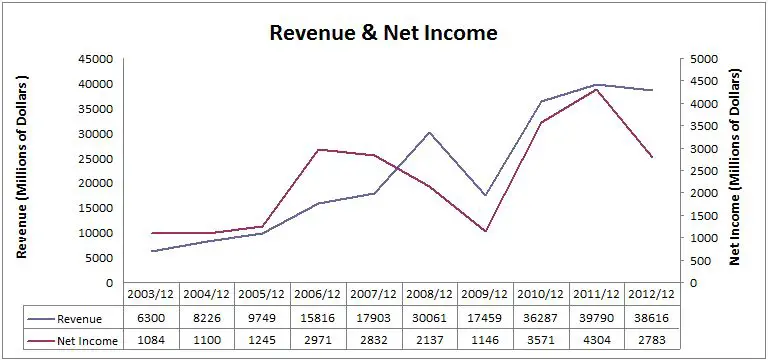
Revenue and net income appears to be going up, but it is erratic. When revenue per share and EPS are examined a similar trend emerges.
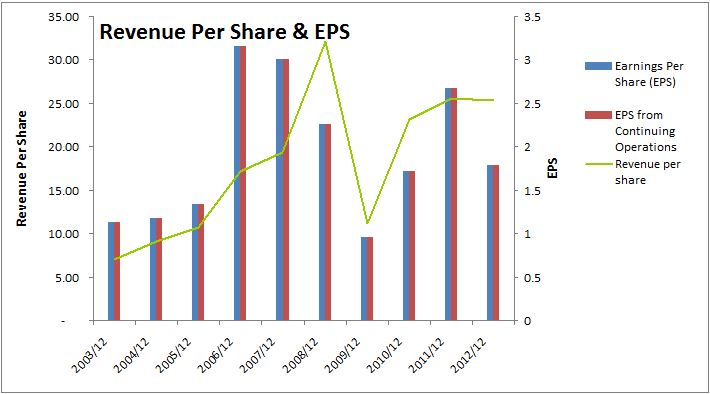
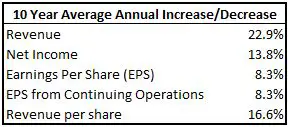
While earnings are erratic, there are no losses, and when the 10 year average annual growth rates are examined the results are good. The 10 year average annual increases to the various revenue and earnings measures in the table below are all above the 8% I like to see.
Dividends
A quick look at the Canadian Dividend All-Star List tells me that Suncor Energy has increased their dividend for 10 consecutive calendar years in a row.
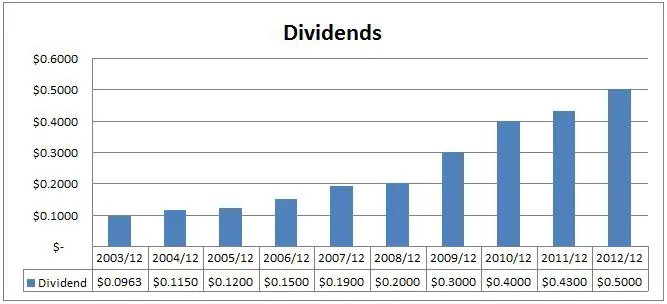
The chart shows a steadily increasing dividend, exactly what I like to see from a dividend growth perspective.
Dividend Growth
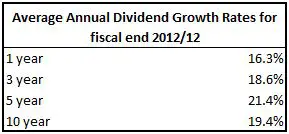
Suncor Energy recently increased their quarterly dividend substantially with the dividend recorded earlier this month. They increased it a whopping 53.8% from $0.13 to $0.20. As you can see from the table below, Suncor Energy already had impressive average annual dividend growth rates, and with this most recent increase it looks like Suncor Energy will be continuing this trend. A large dividend increase is a sign by management that they expect good things in the future.
I like to compare the EPS growth over the past 10 years to the 10 year growth rate to see if dividends have been growing faster than earnings. If the dividend has been growing faster than earnings, I would expect dividend growth to slow in future years. A dividend growth rate consistently above EPS growth is unsustainable. If dividend growth is higher than earnings, I want to see a lower payout ratio so that the dividend is sustainable.
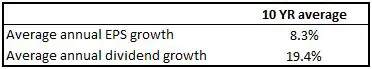
The dividend growth is almost double that of earnings which is not a sustainable trend.
Dividend Sustainability
When looking at the sustainability of dividends, I like to focus on two areas: the payout ratio and estimated future earnings.
- Payout Ratio
The payout ratio is calculated as dividends per share divided by EPS. The idea is to have a company pay for its dividend with the earnings it brings in and still have some left over for growth. I like to see a payout ratio of less than 60% as this allows for some future dividend growth, while still allowing the company to use some of its earnings to fund company growth. For utilities and telecoms I’ll allow a slightly higher ratio.
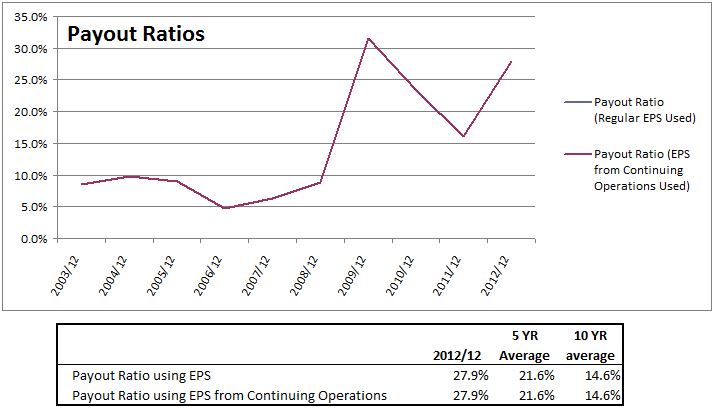
The company has been increasing dividends faster than earnings, but because they have a reasonable payout ratio the dividend is sustainable. The payout ratio has been increasing and with the most recent large dividend increase I expect the payout ratio to go up some more. Even with the higher payout ratio there is still plenty of room for further increases.
- Estimated Future Earnings
It’s important to look to the future as well as to the past. I’m generally looking for companies with an 8% dividend growth rate. In order for a company to sustain this level of dividend growth I want to see that their estimated earnings are above 8%. It’s best to take these estimates with a grain of salt as a lot can happen in 5 years, and the further away the estimate the less accurate it gets.
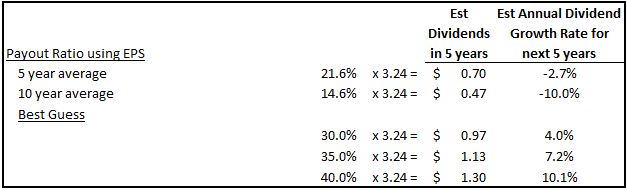
Analysts expect EPS to be $3.24 in 5 years. Using the 5 and 10 year historic payout ratio averages would indicate a decrease in dividend growth. I don’t think a dividend cut is likely as the most recent dividend increase was over 50%. I think it is more likely that a higher percentage of earnings will be used to pay dividends. I’d guess that Suncor Energy will be paying out 30% to 40% of earnings going forward. This would result in an average annual dividend growth ranging from of 4.0% to 10.1%. With Suncor Energy’s strong dividend growth history and its recent large dividend increase I expect annual dividend growth at the high end of this range, or higher.
Competitive Advantage & Return on Equity (ROE)
Suncor Energy’s ROE doesn’t look very good and has been decreasing, which is a trend I’d like to see reversed.
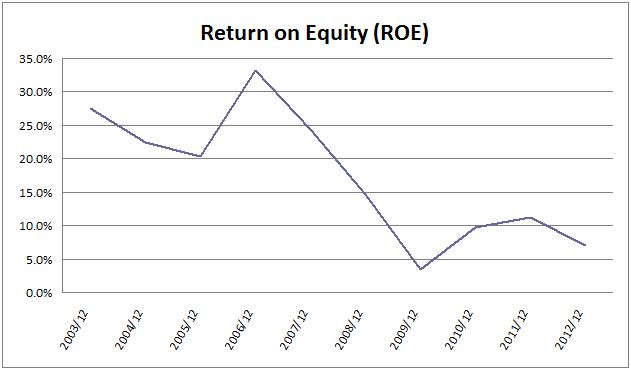
Suncor Energy’s ROE is not all that encouraging. Yahoo Finance shows the Independent Oil & Gas industry ROE average as 5.2%. Suncor Energy is above the industry average, but when I looked at a few Canadian competitors Suncor Energy is still below them.
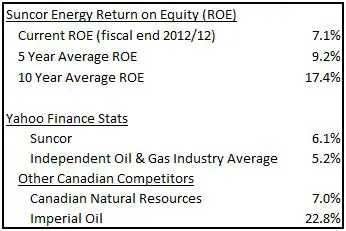
Suncor Energy’s ROE has been dropping and I would say that Suncor Energy doesn’t have much of a competitive advantage.
Debt & Liquidity
I want to invest in companies that are fiscally responsible, so it is important to look at debt levels and see that they are at reasonable levels.
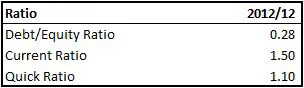
Suncor Energy looks to be in good shape as all the ratios are where I’d want them to be.
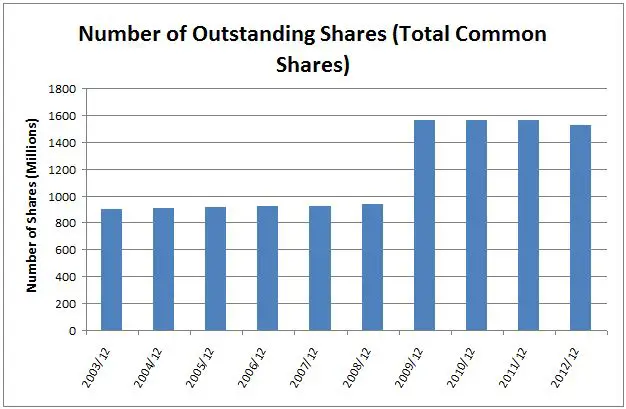
Shares Outstanding
Shares outstanding jumped up in 2009. Other than that there hasn’t been much activity. Suncor Energy was recently granted approval for a $2 billion share buyback program, so I expect this number to drop in the near future.
Valuation
I use the lowest price for the fiscal years to determine the 5 year, 10 year and 2008-2011 averages. Investors commonly use 5 and 10 year averages, but I like to include the fiscal 2008 to 2011 low price average, as I feel that the low prices during this era represent a reasonably low stock price. During 2008 and 2009 most companies experienced a really low price due to the Global Financial Crisis followed by increases in 2010 and 2011.
I use 6 main ratios to determine a fair price: Yield, Discount/Premium of the low price compared to the Graham Price, P/E, P/B, P/Sales and P/Cash flow. I like to look at both EPS and EPS from continuing operations so it ends up being a total of 8 ratios as the Graham Price an P/E both use EPS.
I get the following for Suncor Energy.

* Calculation Notes: I compare the low price to the calculated Graham Price (GP) to determine the discount or premium to GP. I calculate the GP using the square root of (22.5 x Book Value x EPS*). For EPS in this formula I use the lesser of the 3 year EPS average or the current EPS. If the GP calculated is negative then I set the Discount/Premium to GP as -25%. The other ratios are calculated in the normal fashion.
I used these valuation averages to come up with target prices and compare this strategy to previous years. Ideally what I’m looking for is a strategy that would have given me a chance to buy the stock in two to three fiscal years in the past 10 fiscal years. It’s not always possible to test my strategy back 10 years, due to limited financial information, but I do my best.
In the below table I was able to highlight the target prices from strategies that would have given you a target price above the low price in 2 – 3 of the past 10 fiscal years. I’ve used the average of these to determine the target price.
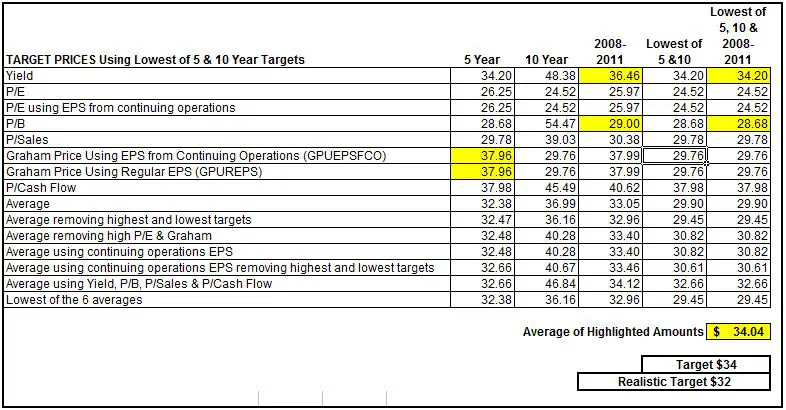
My valuation tests put my target buy price at $34. Typically I don’t like to invest in stocks that have a dividend yield below 2.5%, so I lowered the realistic target to $32 which is the 2.5% yield price.
Before I buy a stock I like to look at Morningstar’s 5 star rating as a quick way of seeing what others think of the stock. If a stock has a 4 or 5 star rating then they consider the stock to be trading at discount to fair value. A 1 or 2 star rating indicates a premium to fair value and a 3 out of 5 rating suggests the price is close to fair value. Currently Suncor Energy has a 5 star rating as the price is below their “consider buy” price of $36.40. My target is a little less than this, but still in the same ballpark which is reassuring.
Trend Analysis
I also like to look at INO`s Free Trend Analysis prior to investing to see if I should hold off or not. Sometimes it is nice to see if the stock is trending down or up before buying it. For June 10, 2013 INO is showing a downtrend for Suncor Energy:
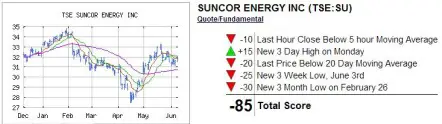
To see the most recent trend analysis for Suncor Energy or to sign up for free trend analysis’s click here. INO also has a list of the top 50 trending stocks and free trading seminars and videos.
Other Investment Options in the Same Industry
Looking in the May 31, 2013 Canadian Dividend All-Star List I found Canadian Natural Resources and Imperial Oil to be legitimate dividend growth candidates in the same industry.
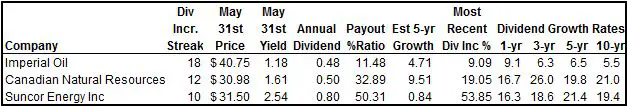
Imperial Oil has the longest dividend streak, but its dividend yield is too low for me to consider investing in it right now. Imperial Oil also has the lowest dividend growth rates. Canadian Natural Resources looks quite appealing with a 12 year dividend streak, a strong 5 year estimated annual EPS growth rate of 9.51%, dividend growth rates around 20% annually and a low payout ratio of 33%. If the yield got up to 2.0% I’d be very interested in investing in Canadian Natural Resources.
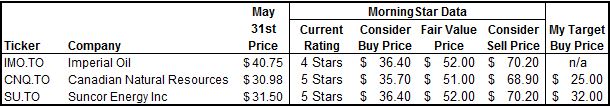
From a value perspective these companies look relatively cheap. Morningstar has a 4 star rating for Imperial Oil and a 5 star rating for Canadian Natural Resources.
Suncor Energy and Canadian Natural Resources both have a five star rating, but Suncor Energy has a better dividend yield. If Canadian Natural Resources’ price where to drop to $25, which would result in a dividend yield of 2.0% I’d consider investing in it. Imperial Oil has a very low yield and the price would have to drop significantly to get to a yield ranging from 2.0% to 2.5% so I didn’t bother determining my target price.
There are some other compelling options in this industry, but they don’t meet my minimum dividend yield requirements, so for the time being Suncor Energy is looking like the best option from a dividend growth perspective.
Conclusion:
Suncor Energy doesn’t have a very good ROE, but other than that it shows some good dividend growth fundamentals. They have a strong dividend growth history with 10 years of consecutive dividend increases, and annual average dividend growth rates around 16% to 20%. The most recent dividend increase of almost 54% is a very good sign from management that they expect good things in the future and that they plan on paying out more dividends. Their payout ratio is reasonable and their dividend is sustainable. Because the dividend policy may be changing it is harder to predict the future dividend growth based on past payout ratios, but my guess is that future annual dividend growth will good at around 10% or higher.
When I look at the stock chart it looks like there have been plenty of opportunities to buy below my target price recently and trend analysis indicates that the stock is trending down so there may be some opportunities to buy at an even lower price. Morningstar currently has a five star rating on the stock and I don’t get a chance to buy shares very often due to my conservative investing approach, so instead of waiting for a potential share decline I just bought some shares at $31.84. What’s the point of having target prices if you don’t use them right?
Disclaimer
I own Suncor Energy. You can see my portfolio here. I am a blogger and not a financial expert. These writings are my own opinions and should not be considered financial advice. Always perform your own due diligence before purchasing a stock. I mention target prices in this article, but this is not a recommendation to buy this stock, it is just a target price I use for my own personal investing that I have chosen to share.
Newsletter Sign-Up & Bonus
Have you enjoyed our content?
Then subscribe to our newsletter and you'll be emailed more great content from Dividend Growth Investing & Retirement (DGI&R).
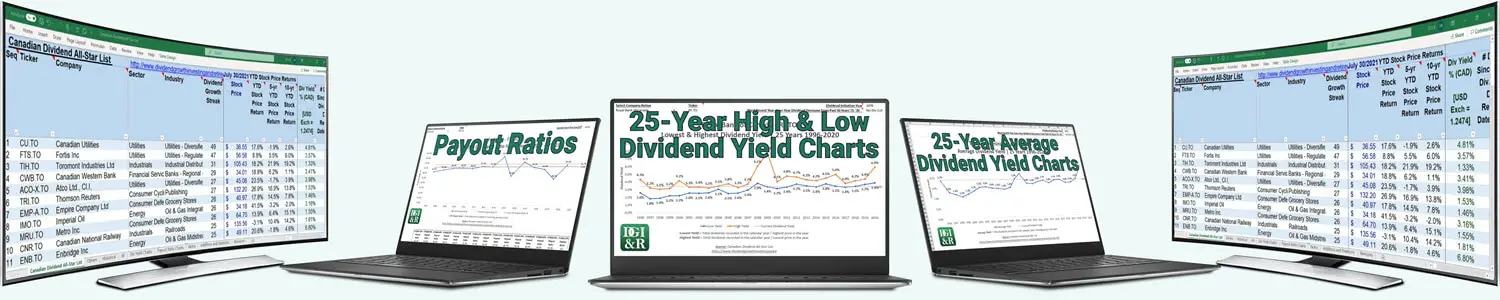
BONUS: Subscribe today and you'll be emailed the most recent version of the Canadian Dividend All-Star List (CDASL).
The CDASL is an excel spreadsheet with an abundance of useful dividend screening information on Canadian companies that have increased their dividend for five or more years in a row.
The CDASL is one of the most popular resources that DGI&R offers so don't miss out!


Its a very good analysis. Is there any website to see 5 year or 10 year Avg return.Do you calculate it for every year then avg it.
To calculate growth rates I use the compound annual growth rate. Here’s link to the formula: http://www.investopedia.com/terms/c/cagr.asp. Once you have the beginning and ending stock price for whatever period (5 or 10 years, etc.) you are looking at you’ll be able to calculate the growth rate.