Dividend Growth Investing & Retirement is supported by its readers through donations and affiliate links. If you purchase through a link on my site, I may earn a commission. Thanks! Learn more.

Coca Cola Co. is one of those companies that dividend growth investors drool over. The company has been paying out increasing dividends each year for over 50 years. Its products are sold all over through one of the best distribution networks in the world. It has a wide economic moat and Warren Buffet’s company Berkshire Hathaway (BRK.B Trend Analysis) is a significant shareholder in the company.
For a conservative investor like me, it can be hard to find an entry point in great companies like Coca Cola Co. that I’m comfortable with. They don’t go on sale very often. Coca Cola Co. has been creeping closer to Morningstar’s 5 star price of $36 lately, so I thought now would be a good time to take a closer look at the company.
⭐ Find dividend growth stocks that have survived multiple recessions and increased dividends for 5, 10, 25+ years in a row.
10 Year Stock Chart
Coca Cola Co.’s stock has been on a tear since 2009, but then again most stocks have. Looking at the 10 year return it is average. The 10 year annual average return is 4.4%. If we include the dividend payments over the past 10 fiscal years (Total dividends paid of $7.22) then the total average annual return would be 6.2% with the average return from dividends representing 1.8%.

Revenue and Earnings
I get the following growth rates based on the most recent fiscal period end December 31, 2012.
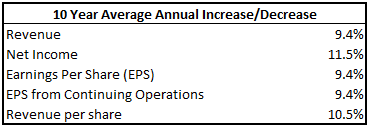
All 5 growth rates are above the 8% I like to see. The rates above coupled with the consistency of growth shown in the chart below make for a great picture.
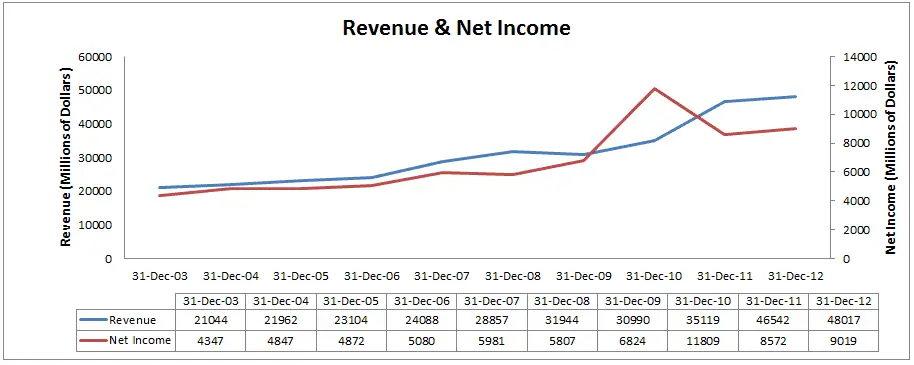
Revenue per share and EPS (chart below) don’t show quite as nice a trend as overall revenue and net income (chart above), but they are still good.
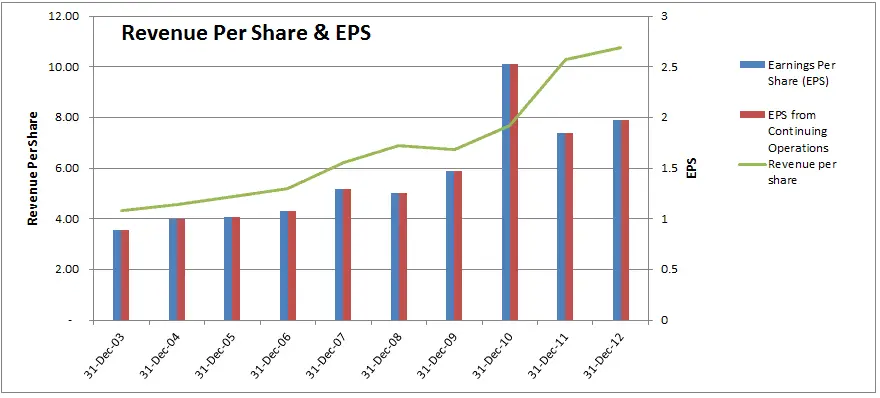
Analysts are estimating annual EPS of $2.09 for the fiscal end December 31, 2013 and $2.22 for December 31, 2014, so it looks like this upward trend is expected to continue.
Dividends
Coca Cola Co. is a dividend king having increased their dividend for 51 consecutive years in a row. They are currently tied for 12th among US companies for the longest dividend streak. Their most recent increase was recorded in March 2013 when they increased the quarterly dividend by 9.8% from $0.2550 to $0.2800. I expect them to announce another increase in February 2014.
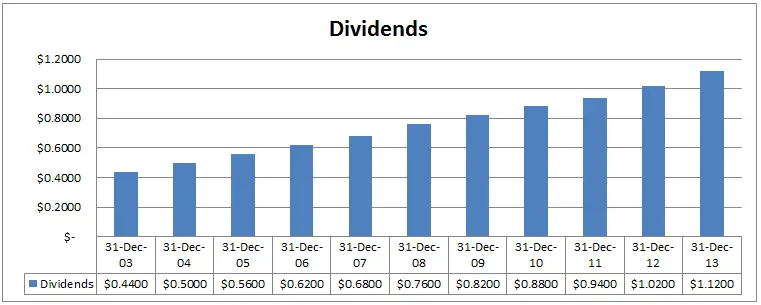
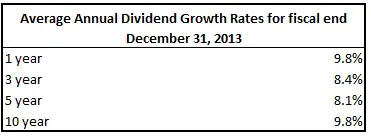
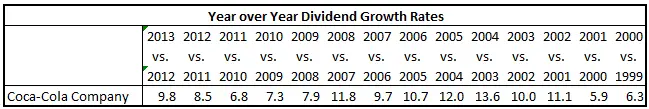
Each year the dividends keep getting higher, and you can see from the dividend growth rate table below that they have been increasing at a very consistent and high rate of around 8-10%.
Dividend Sustainability
The good divided growth has been accompanied by a similar EPS growth rate which is a good indication that the dividend is sustainable. Dividend growth fueled by earnings growth is ideal when looking at dividend sustainability.
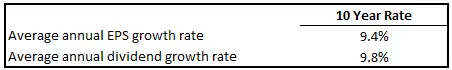
As EPS growth has been roughly equal to dividend growth for the past decade, it makes sense that the payout ratio has stayed in the same area for this period.

For the most part it looks like Coca Cola Co. is targeting a payout ratio of around the 50% to 60%. A payout ratio in this range is sustainable and allows for future dividend growth.
Estimated Future Dividend Growth
The average EPS estimate for the December 31, 2013 year is $2.09 and they are estimating EPS growth of 5.55% for the next five years. The 2013 dividends totalled to $1.12. Using these figures and assuming a payout ratio of 50% to 60% would result in dividend growth ranging from 4.1% to 8.0%
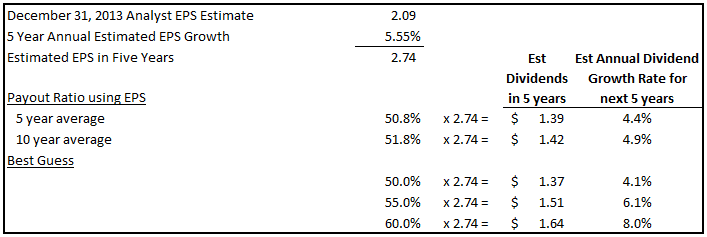
I think dividend growth will be at the higher end of this range, if not higher as the company has a strong history of increases around 8-10% over the long term.
If you look at the year over year divided growth rates going back to 2000 you’ll see that the lowest annual increase was 5.9% and there are only 3 instances over the last 14 years of annual dividend growth rates below 7%.
Based on their dividend history I think long term dividend growth will be around the 8% mark going forward.
Related article: Can Past Dividend Growth Rates Be Relied Upon To Predict Future Rates?
Competitive Advantage & Return on Equity (ROE)
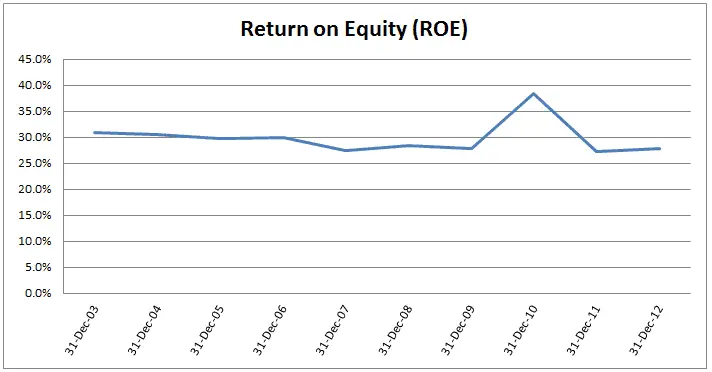
Coca Cola Co.’s ROE has decreased a bit over the past decade, but overall it is still great. A consistent ROE of above 25% coupled with the fact that it has increased its dividend for 51 years in a row indicates a strong competitive advantage.
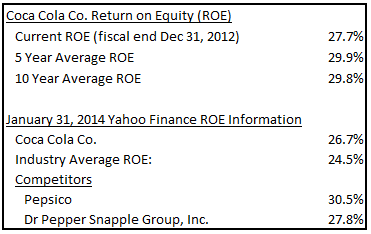
Coca Cola Co.’s ROE is currently below PepsiCo Inc. and Dr Pepper Snapple Group, but it is above the industry average. While it may currently be below some of its competitors I still consider Coca Cola to have a strong competitive advantage because it has such a vast distribution network. Morningstar also rates Coca Cola Co. as a wide moat stock.
Debt
Coca Cola Co. currently has a credit rating of AA-, which is good.
Shares Outstanding
Shares outstanding have decreased significantly over the past decade. They have been able to decrease shares outstanding and still increase the dividend at a good rate, which is great to see.

Valuation Metrics
I use 6 main ratios to determine a fair price: Yield, Discount/Premium of the low price compared to the Graham Price, P/E, P/B, P/Sales and P/Cash flow. I like to look at both EPS and EPS from continuing operations so it ends up being a total of 8 ratios as the Graham Price an P/E both use EPS. You can read more about my valuation method here.
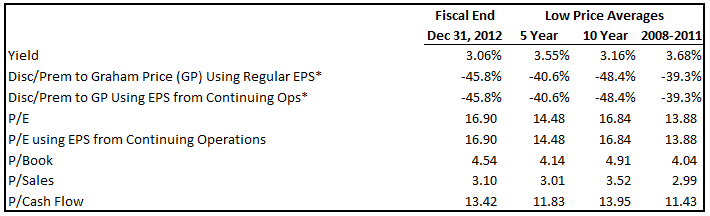
* The discount or premium to Graham Price hasn’t been calculated in the normal fashion. For the details read this article.
Looking at the table above it looks like a yield of around 3.5% or higher or a P/E around 13 or 14 would indicate a decent entry point.
Target Buy Price
I use the averages from the previous table to determine my target buy price. Using these averages creates a lot of different target prices, so I back-test this strategy over the past 10 years. I identify which of the 8 valuation techniques would have given me a chance to buy the stock in two to three fiscal years in the past 10 fiscal years. It’s not always possible to test my strategy back 10 years, due to limited financial information, but I do my best. The results are highlighted below.
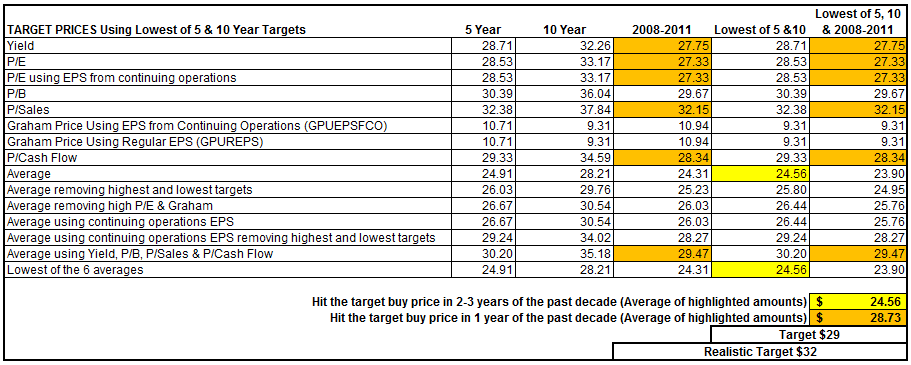
When I back tested this strategy I was only able to find two other instances where the price fell below my target buy price in 2-3 years of the past decade. These are highlighted in yellow. Usually there are a lot more target prices that I take the average of, so I was wary of this target buy price. The more valuation metrics that indicate a cheap stock the better, so having only two targets was worrying.
I went back and identified other instances where the price fell below my target buy price in 1 year of the past decade and was surprised to see a bunch of target prices fit the criteria (Highlighted in orange). In theory this is the more conservative strategy, but it gave me a higher target buy price of $29.
A target buy price of $29 would result in a dividend yield of 3.86% ($1.12/$29), which is quite high historically.
![]()
Looking at highest yields for the past decade I think a yield of 3.5% based on the 2013 dividends of $1.12 is a better target. This would be a target buy price of $32 which I think is a more realistic, but still conservative target buy price. Morningstar has a five star price of $36 for Coca Cola Co. and their fair value estimate is $45. My target buy price is in the ballpark of their five star price so I feel comfortable leaving my target buy price at $32.
With current prices (January 31, 2014) around $38 for Coca Cola Co, the price would have to drop about 18% before I’d consider investing.
Trend Analysis
An 18% drop likely means I’ll be waiting around for some time. Looking at the trend analysis of Coca Cola Co. it appears to be in a down trend which is great if you are looking to buy.
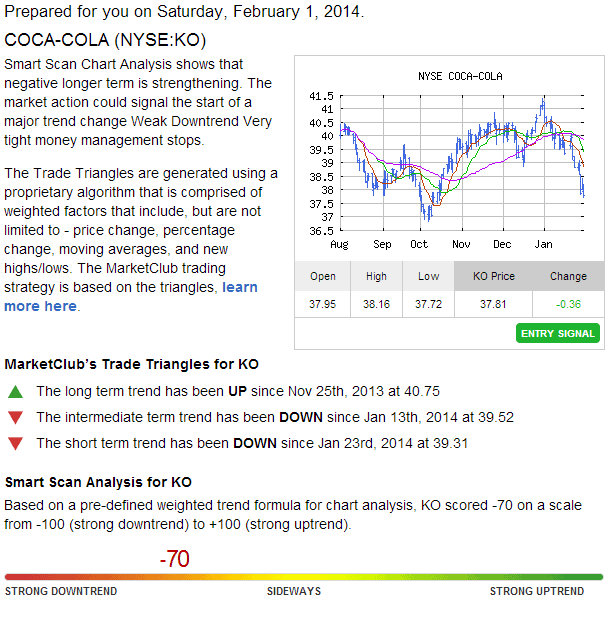
To see the most recent trend analysis for Coca Cola Co. or to sign up for free trend analysis’s click here. INO also has a list of the top 50 trending stocks and free trading seminars and videos.
Other investment options in the same industry
Some other companies to consider in the industry are PepsiCo Inc. (PEP Trend Analysis) and Dr Pepper Snapple Group (DPS Trend Analysis). Let’s see how they compare to Coca Cola Co.
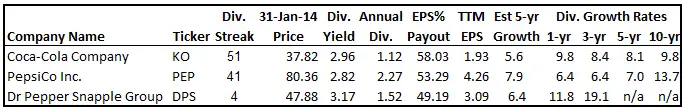
PepsiCo Inc. has a lot of similarities with Coca Cola from a dividend growth perspective. The yield and payout ratio are similar and they both offer long dividend streaks. The dividend growth in recent years has been better at Coca Cola Co., but analysts are more optimistic about PepsiCo’s EPS growth over the next five years. These factors make it difficult to guess which company will have better dividend growth going forward. All-in-all I think PepsiCo Inc. is a good dividend growth stock.
At first glance you might discount Dr Pepper Snapple Group because of its low dividend streak. 4 years of dividend increases in a row is tiny compared to PepsiCo Inc.’s 41 years and Coca Cola Co.’s 51 years. The reason that the streak is so low is because it is a relatively new entity. Dr Pepper Snapple Group was established in 2008 following the spinoff of Cadbury Schweppes Americas Beverages. They started paying a dividend in 2009 and increased it each year since. Without a long dividend history it makes it hard to compare to the others. The 1 and 3 year rates are higher than Coca Cola Co., but comparing the 5 and 10 year rates give a better indication of the better dividend growth candidate.
Dr Pepper Snapple Group offers a slightly higher yield, a slightly lower payout ratio and slightly higher growth estimate. These would all indicate that Dr Pepper Snapple Group offers a better dividend growth play, but because the dividend history is short, I’m not 100% convinced.
Normally I like to see 10 years of dividend increases from a US company before I invest. I feel that after 10 years, dividend increases become a part of the management culture. Here’s my thinking behind the theory. Say you are a CEO and you’ve done a good job, consequently the dividend has been increased a few years in row. Something goes wrong and the decision is made to keep the dividend steady instead of increasing it. The decision to not increase the dividend was easier to make because the company doesn’t have a long history of dividend increases. Companies with long dividend streaks are expected to keep increasing their dividend, when they don’t their shareholders are generally more upset. When a company has a shorter dividend streak the dividend increases are viewed as a nice bonus, not an expectation. I like it when dividend increases are immersed in corporate culture and a dividend increase each year is expected. That’s why I prefer 10 or more years of dividend increases.
In the end Dr Pepper Snapple Group could be a decent dividend growth candidate, but if we look at some additional Morningstar data then I think PepsiCo Inc. and Coca Cola Co. are better options.
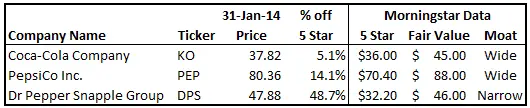
You can see that Dr Pepper Snapple Group is currently priced around its fair value and it has a narrow moat rating. Its low dividend streak and narrow moat rating will keep me on the sidelines for now.
Related article: Wide Moat Stocks In The US Dividend Champions List
From the table above it looks like Coca Cola offers the best value at current prices. Both PepsiCo Inc. and Coca Cola Co. have a wide moat rating and good dividend growth fundamentals, so I’d consider investing in either if prices dropped below my target buy price.
Conclusion
Coca Cola Co. is a great company. They have a wide moat and strong dividend growth fundamentals. With dividend growth rates around 8-10% and a dividend streak of 51 years it is easy to see why this is a favorite stock among dividend growth investors. I think future dividend growth will be similar to past rates, which is why I’d love the opportunity to buy shares. I’d consider investing in Coca Cola Co. if the share price dropped below my target buy price of $32.
Disclosure: I own shares of PepsiCo Inc. You can see my portfolio here, my monthly dividend income here, and portfolio updates here.
Photo credit: zetson / Foter / CC BY-NC-SA
Newsletter Sign-Up & Bonus
Have you enjoyed our content?
Then subscribe to our newsletter and you'll be emailed more great content from Dividend Growth Investing & Retirement (DGI&R).
BONUS: Subscribe today and you'll be emailed the most recent version of the Canadian Dividend All-Star List (CDASL).
The CDASL is an excel spreadsheet with an abundance of useful dividend screening information on Canadian companies that have increased their dividend for five or more years in a row.
The CDASL is one of the most popular resources that DGI&R offers so don't miss out!


Killer analysis.
Own a couple hundred shares of KO. No intention of buying or selling, just holding.
Just tweeted.
Mark
Good idea. Coca Cola is one of the ideal buy and hold stocks for dividend growth investors in my opinion.
Thanks for the tweet.
Great write up on KO. Bloomberg has them ranked 25th on their list of companies with the highest projected dividend growth rate. They are projecting a 3 year div growth rate of 14.4%.
Thorough analysis. It would be nice if it would somehow all ‘add up’ to one numerical number from a scale of 1 to 100…. guess it is the math guy in me.