Dividend Growth Investing & Retirement is supported by its readers through donations and affiliate links. If you purchase through a link on my site, I may earn a commission. Thanks! Learn more.
In Canada there are 9 wide moat stocks and 100 narrow moat stocks, but which of these companies with strong sustainable competitive advantages make good dividend growth investments?
To answer this question, I did three things:

⭐ Find dividend growth stocks that have survived multiple recessions and increased dividends for 5, 10, 25+ years in a row.
- I researched all Canadian wide and narrow moat companies to identify 44 stocks with a 5+ year dividend growth streak.
- I ranked them using a quality scoring system that includes:
- overall safety,
- financial strength,
- credit ratings,
- moat analysis, and
- dividend safety.
- To get a better sense of the best stocks to focus on, I provided additional valuation and dividend metrics like:
44 Wide & Narrow Moat Dividend Growth Stocks
Of the 109 Canadian Wide and Narrow Moat Stocks I identified in my “Each & Every Wide Moat Stock in Canada” and “100 Canadian Narrow Moat Stocks” articles, 44 have dividend growth streaks of 5+ years

I’ve included dividend growth stocks with at least a 5-year dividend growth streak, but I like to focus more on 10+ year streaks as these tend to be more resilient companies.
Or you may want to focus on a 12/13-year dividend growth streak so that the company was not only increasing dividends through the COVID-19 pandemic but also in 2008/2009 through the global financial crisis.
Yes, dividend safety, valuation, financial health, etc. still need to be evaluated, but this list of 44 make a good starting point to create a watchlist of Canadian dividend growth stocks.
I’m hoping that this article will be one that you can keep referring back to for high-quality stock ideas.
Some Finer Points
The stocks with a 4* streak have increased their dividend in 2020, but they won’t officially get the 5-year streak until Jan 1, 2021.
Canadian Pacific Railway Ltd (TSE:CP; NYSE:CP) is an example of this. They have 4 years of consecutive dividend increases, but CP Rail already announced a 15% dividend increase in July 2020 so their streak remains alive, and it’ll be updated to 5 years at the end of 2020.
I also removed any stocks that will lose their streak in 2021. Boralex (TSE:BLX) is an example of this. In 2020, it’s dividend growth streak was 4 years, but 2020 dividends will be the same as 2019 so it’s dividend growth streak will drop from 4 to 0 at the beginning of 2021.
If you want to learn more about the Canadian Dividend All-Star List and how these dividend streaks are calculated, read this article: Canadian Dividend All-Star List: Best Resource to Find High-Quality Canadian Dividend Growth Stocks
Before we dig into the quality rankings for each company, let me explain how I calculate a quality score.
Dividend Growth Quality Ranking System
I’m basing my Canadian quality rankings on David Van Knapp’s quality snapshot scoring system.
In lesson 20 of David Van Knapp’s dividend growth investing lessons series he summarizes his quality snapshot scoring system as the following:
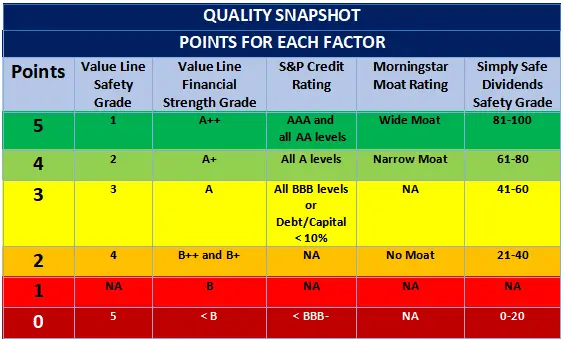
Source: David Van Knapp’s DGI Lesson 20: My ‘Quality Snapshot’ Grading System
The scoring system is comprised of five different factors:
- Safety Ranks from Value Line,
- Financial Strength Grades from Value Line,
- S&P Credit Ratings,
- Morningstar Moat Ratings, and
- Dividend Safety Scores from Simply Safe Dividends.
For a more in-depth explanation refer to his article, or for that matter, take a look at his whole series of dividend growth investing lessons. It’s a resource so good that you will keep referring back to it.
I really like this methodical approach for analyzing the quality of US dividend stocks, BUT…
For Canadian companies, it doesn’t work as well as the various stock research companies don’t cover a lot of Canadian stocks.
For example, Value Line, typically only covers the larger Canadian stocks.
Just because Value Line or another stock research company doesn’t cover a Canadian stock, doesn’t mean it’s not a high-quality company.
As a result, I’ve tweaked David’s system to make it more suited for Canadian coverage.
Introducing the Canadian Quality Ranking System …
Canadian Quality Ranking System
I’ve kept David’s system the same, but I’ve supplemented it with my judgment, financial metrics, and some more Canadian focused services like Dividend Stocks Rock to make it more suited for Canadian coverage.
Here’s what I came up with.
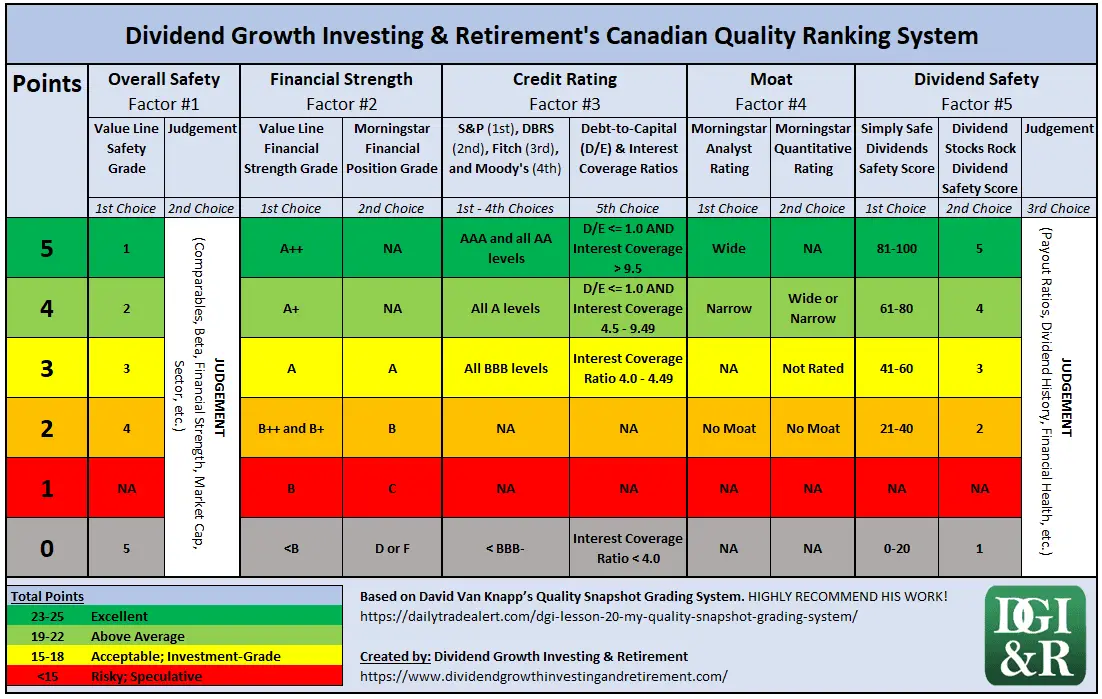
Here is a summary of how I evaluate each of the five quality factors.
Overall Safety – Factor #1
1st Choice = Value Line’s Safety Rank | 2nd = Judgement
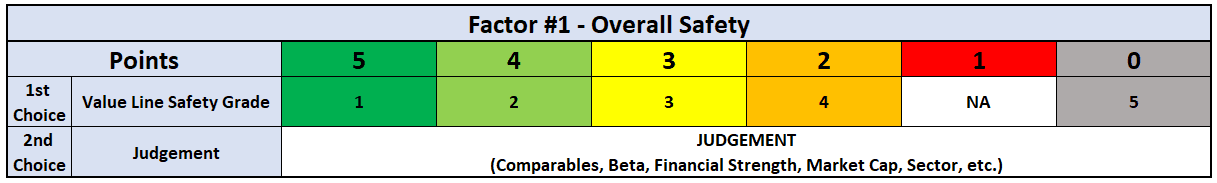
First, I try to use Value Line’s Safety Rank, which is a combination of a stock’s weekly price stability over a five year period and its financial strength.
Safety Rank = Price Stability + Financial Strength
Here’s the link to Value Line’s more in-depth explanation of their scoring system.
High safety ranks come from highly stable prices and a strong financial strength. Low scores, the opposite.
If the Value Line rating isn’t available I have to use my own judgement.
Overall Safety Judgment Factors
To come up with a score out of 5 for overall safety I’ll look at a number of different factors.
I start with looking at safety scores of comparable companies that Value Line does cover and then looking more into the specific price stability and financial strength factors that make up the safety rank.
Price Stability Judgement Factors
- Look at comparable companies that are covered by Value Line.
- Check the 5 year beta. It’s not the same as price stability but it’s an indication of the stocks volatility. A lower beta is better in this case.
- Market capitalization (cap). Small cap stocks are typically more volatile than large cap stocks, so I’d tilt small cap stocks to have lower safety scores.
- Sectors. Certain sectors are typically more volatile than others. The basic materials sector for example is typically more volatile than the utilities sector. I might adjust the safety score down for more volatile sectors.
Financial Strength Judgement Factors
Financial strength is already being evaluated in other columns, so I use my judgment and check the Morningstar financial position grade, Credit ratings, and debt metrics.
Financial Strength – Factor #2
1st Choice = Value Line’s Financial Strength Grade | 2nd = Morningstar Financial Position Grade
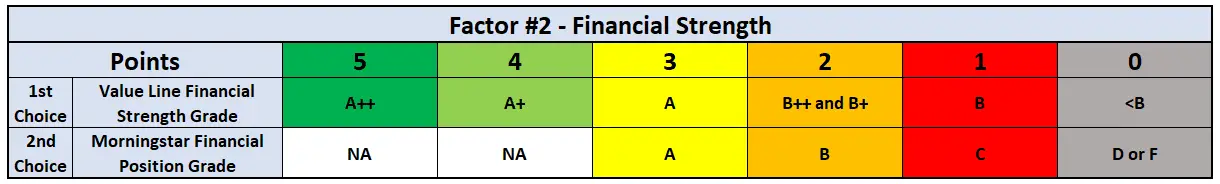
If Value Line’s Financial Strength grade isn’t available I’ll use Morningstar’s Financial Position grade.
I’ve noticed that Value Line’s Financial strength grades are quite conservative compared to Morningstar’s Financial position grades.
As a result, even with an A from Morningstar the highest score would be 3/5. This certainly isn’t perfect, but I noticed for Canadian stocks covered by both Morningstar and Value Line that having an “A” grade from Morningstar meant a “B++” or “A” most of the time from Value Line.
Like I said, not perfect.
Credit Rating – Factor #3
1st Choice = S&P | 2nd = DBRS | 3rd = Fitch | 4th = Moody’s | 5th = Debt Metrics (D/E & Interest Coverage)
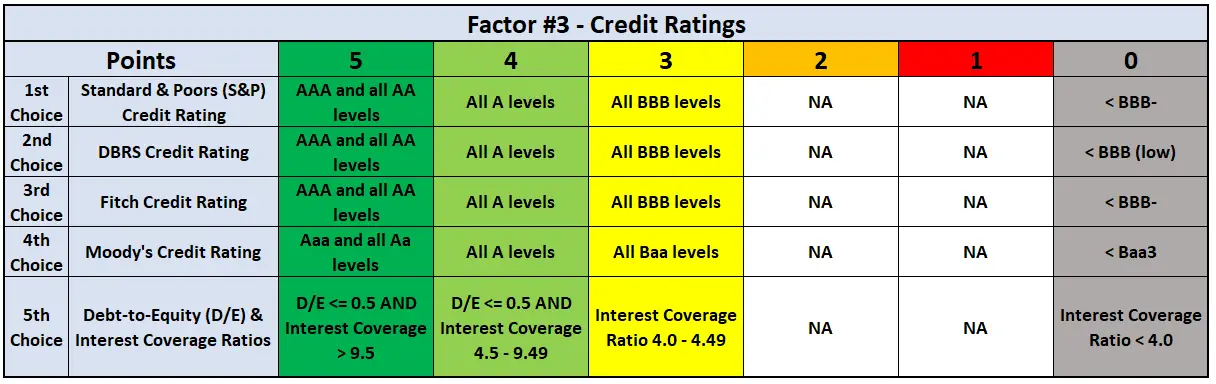
First I’ll check the 4 major credit rating agencies.

If I can’t find a credit rating from one of the rating agencies (Standard & Poors (S&P), DBRS, Fitch, or Moody’s), I use a combination of the Debt-to-capital ratio and Interest Coverage ratio.
Interest Coverage Ratios & Synthetic Credit Ratings
Using the research of Aswath Damodaran on the link between interest coverage ratios and credit ratings I use the table below to find a synthetic credit rating.
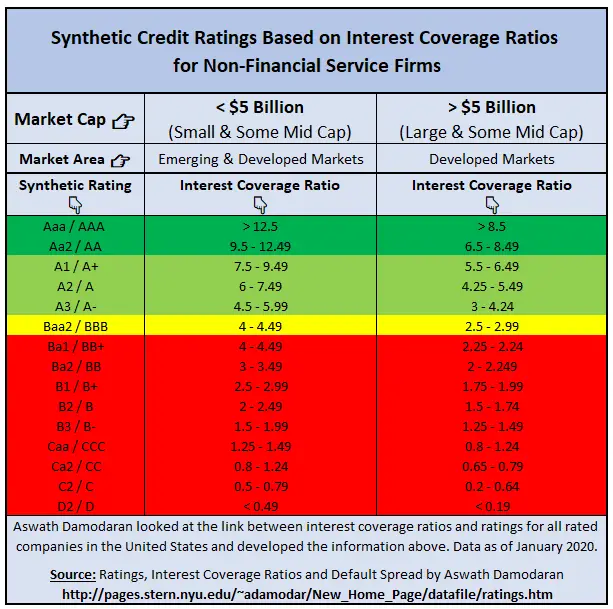
Source: Ratings, Interest Coverage Ratios and Default Spread by Aswath Damodaran
The table above only works for non-financial firms, so don’t use this for banks, insurance companies, etc.
Debt-to-Equity Ratio
A debt-to-equity ratio of less than 1.0 or 100% is used as a pass/fail metric for the higher points (4 & 5).
If the debt-to-equity ratio is higher than 100% then the highest possible points are 3.
You can’t get a 4 or 5 if the debt-to-equity ratio is above 100%, regardless of how good the interest coverage ratio is.
Why a debt-to-equity ratio of 100% or less?
Well, this was one of the criteria mentioned in The Single Best Investment: Creating Wealth with Dividend Growth written by Lowell Miller:
“Half debt and half equity would give you a debt/capitalization of 50%. Except in specific cases weʼll be discussing later, your company should not have a ratio of more than 50%. In other words, it should not have—unless there is a compelling reason to make an exception—more debt than equity.”
Yes, “Half debt and half equity would give you a debt/capitalization of 50%”, but it also gives you a debt/equity ratio of 100%.
The quote mentions a debt-to-capital ratio, but it’s easier for me to pull the debt-to-equity ratio, so I’ve used D/E instead as the same concept applies.
In this article I used the D/E ratio from Morningstar.
Moat – Factor #4
1st Choice = Morningstar Analyst Rating | 2nd = Morningstar Quantitative Rating
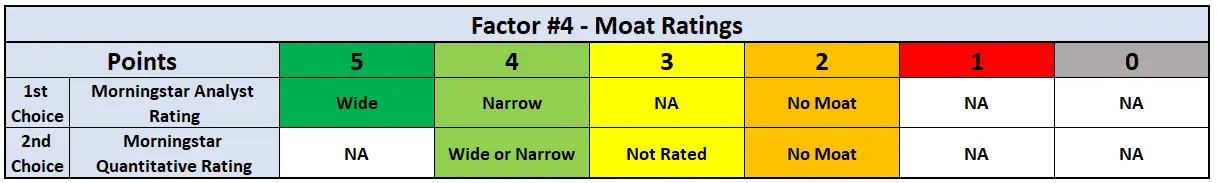
If I can’t find a moat rating from a Morningstar analyst, then I’ll use their quantitative (computer figures it out instead of a human) moat rating.
I think the quantitative ratings are less reliable as they don’t get the same level of scrutiny as analyst ratings.
As a result, I’ve knocked wide moat quantitative ratings down a point in my ranking system.
A wide moat, from an analyst, gets 5 points, but a wide moat quantitative rating only gets 4.
Dividend Safety – Factor #5
1st Choice = Simply Safe Dividend Score | 2nd = Dividend Stocks Rock Dividend Safety Score | 3rd = Judgement
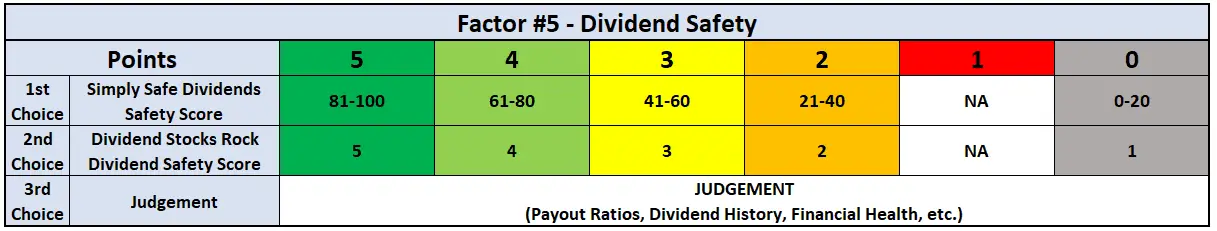
Simply Safe Dividend Scores
First, I try to use the Simply Safe Dividend Score, which uses a score out of 100 to rate the dividend safety of a company.
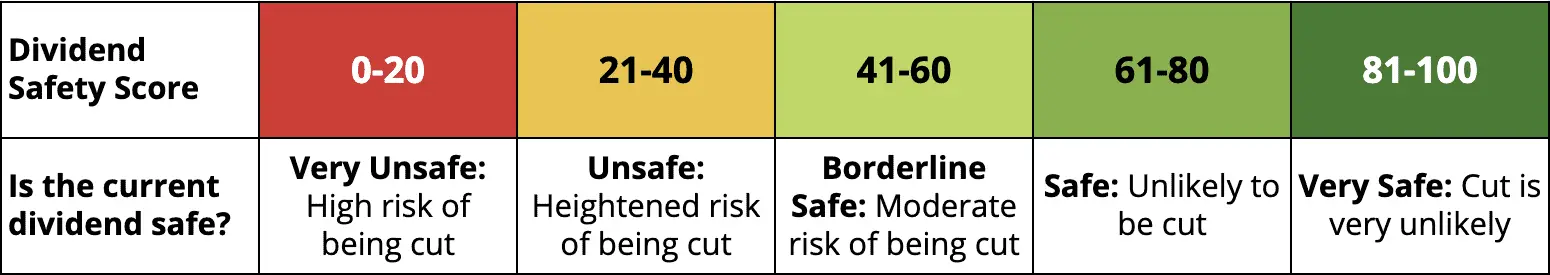
Source: Simply Safe Dividends
If the dividend safety score isn’t available from Simply Safe Dividends, I use Dividend Stocks Rock Dividend Safety Scores.
Dividend Stocks Rock (DSR) Dividend Safety Scores.
Simply Safe Dividends is primarily a US service whereas Dividend Stocks Rock is run by a Canadian.
As a result, Dividend Stocks Rock has much better Canadian coverage for fellow dividend growth investors. The small and mid-cap dividend growth stocks that are often overlooked by other services are usually covered by DSR.
DSR rates the dividend safety of 425+ Canadian and US dividend stocks on a 5-point scale. 5 being the safest.
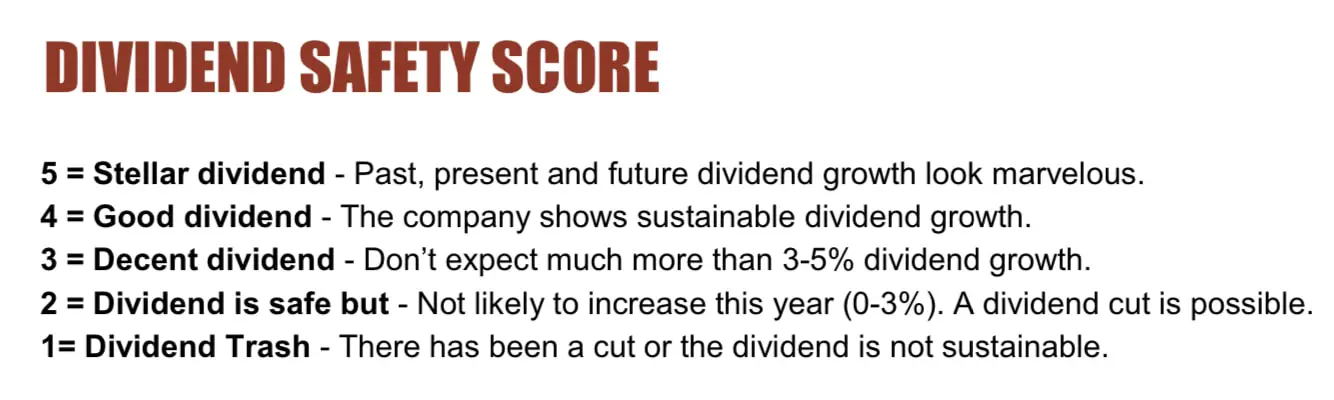
Source: Dividend Stocks Rock
If the dividend safety score isn’t available from Dividend Stocks Rock, I use my judgment.
DGI&R Dividend Safety Judgment Factors
To come up with a score out of 5 for dividend safety I’ll look at a number of different factors like:
- Payout Ratios,
- Dividend History,
- Financial Health,
- Etc.
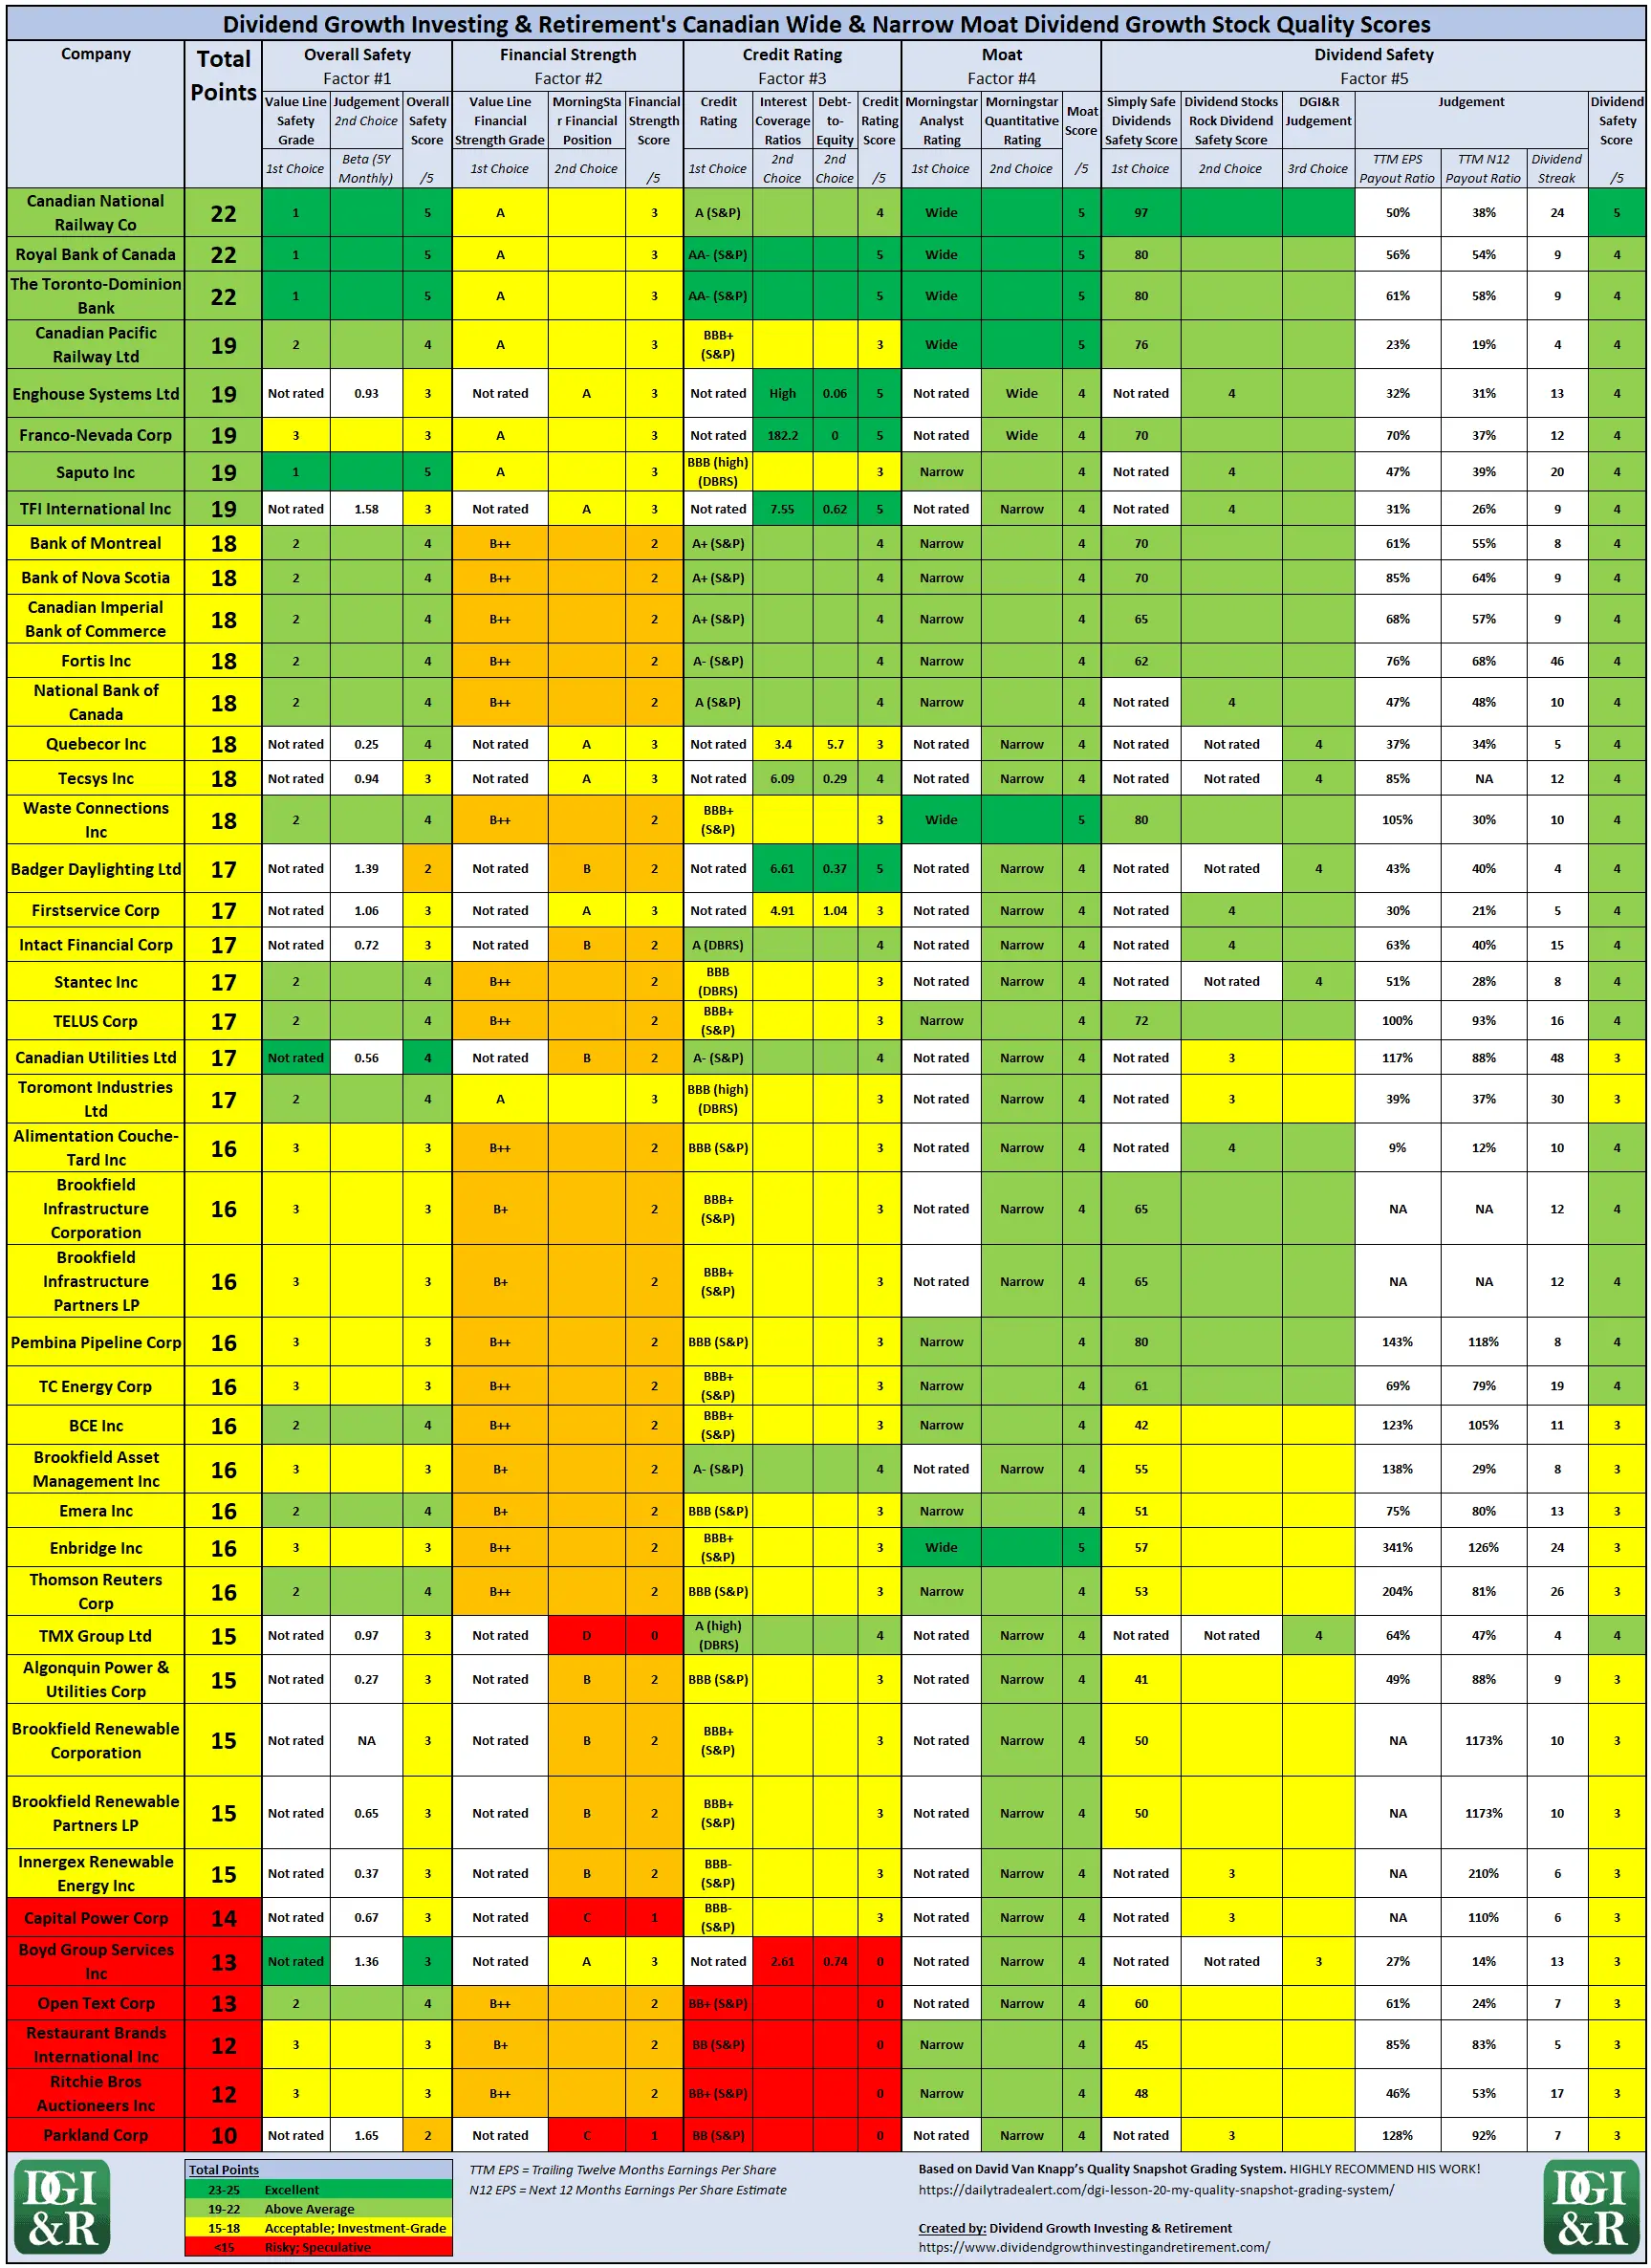
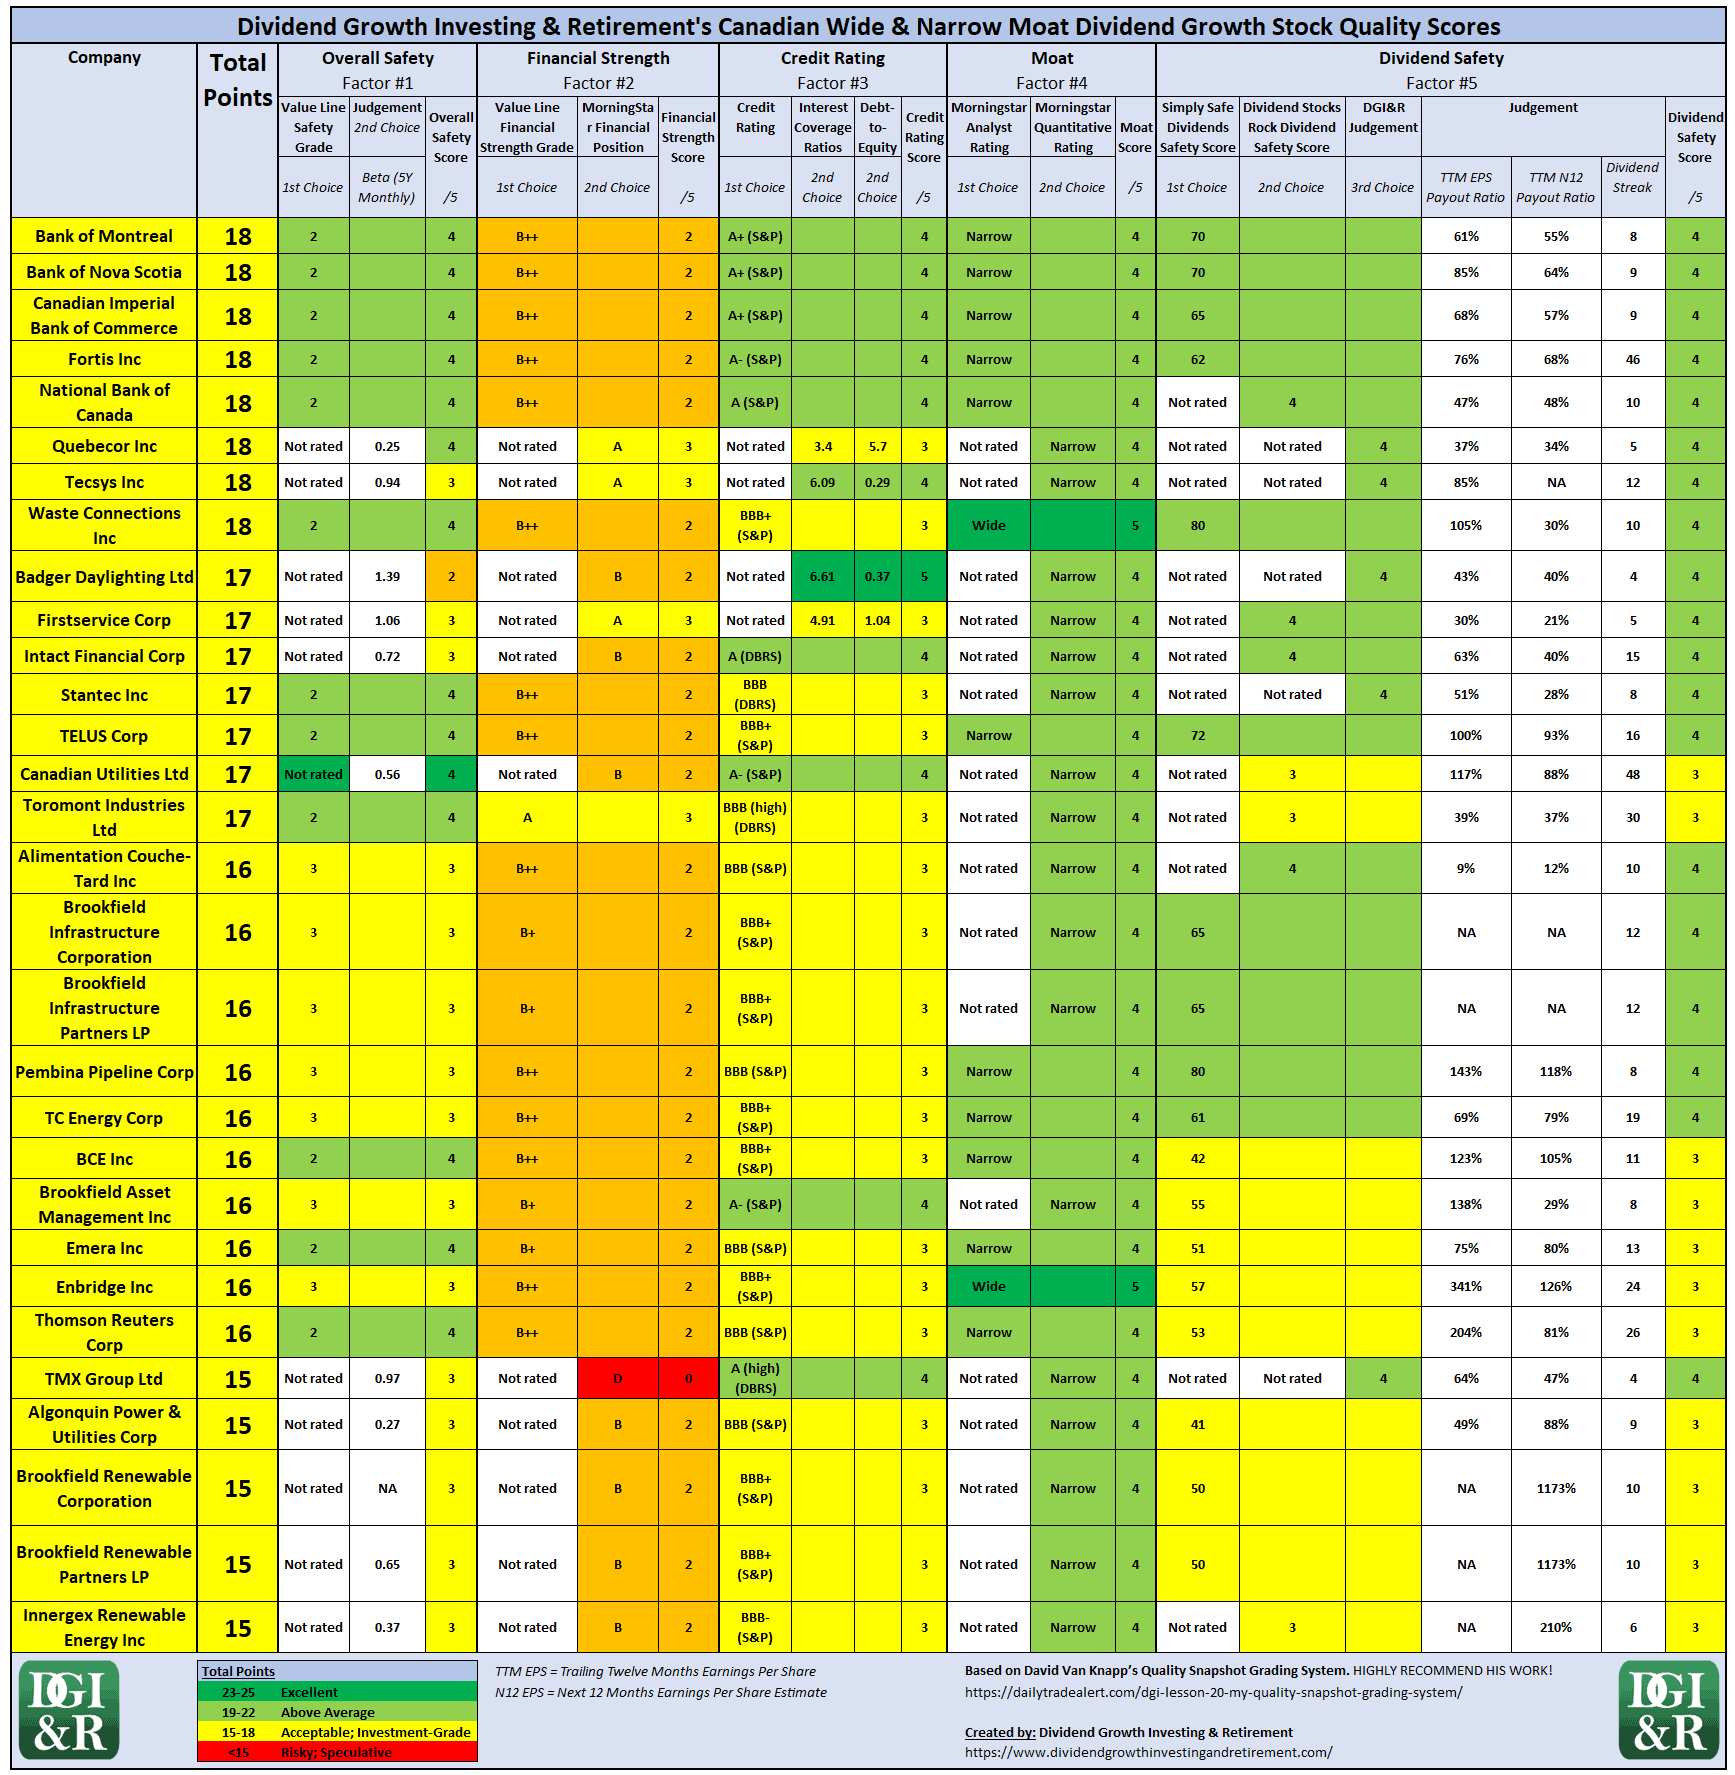
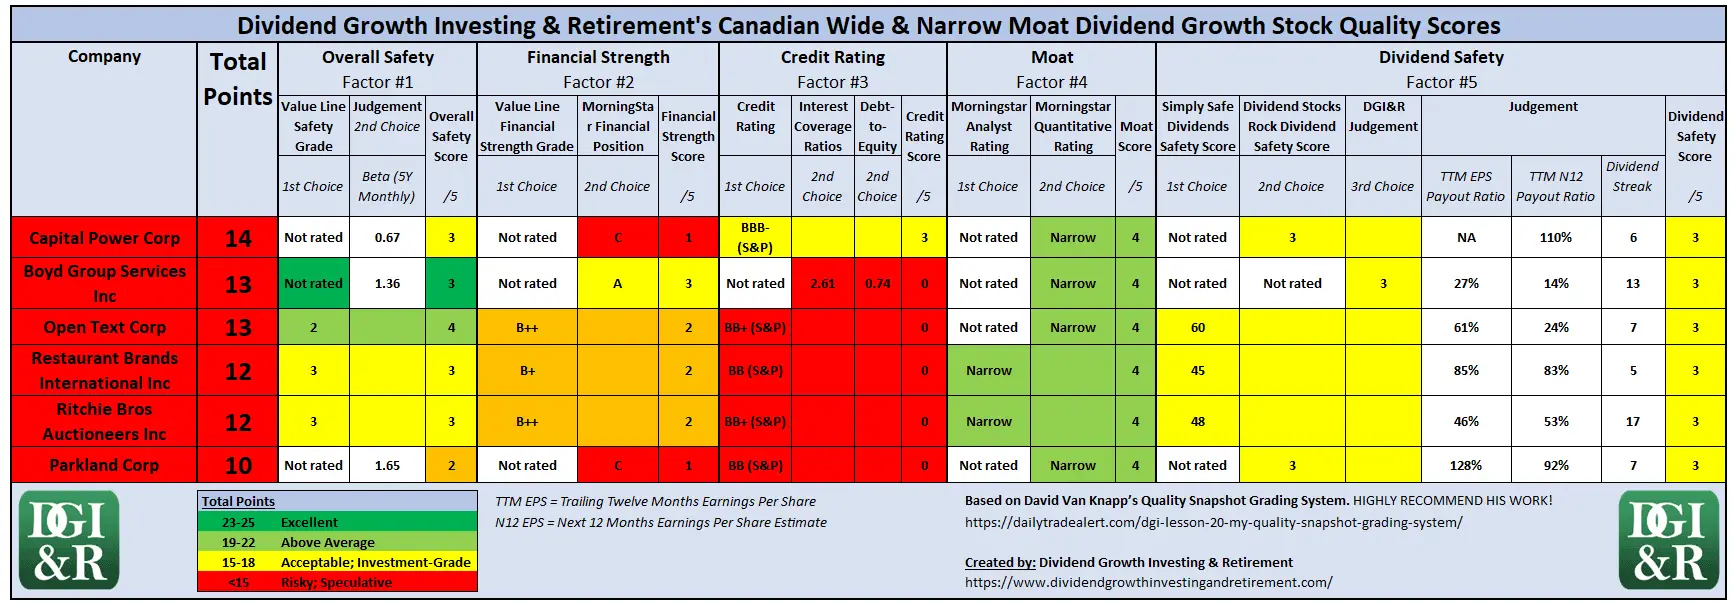
Quality Scores for All 44 Canadian Wide and Narrow Moat Dividend Growth Stocks
I’ve ranked all 44 Canadian wide and narrow moat dividend growth stocks by quality score. For stocks with the same quality score, I used dividend safety as a tie-breaker
Here’s the whole list.
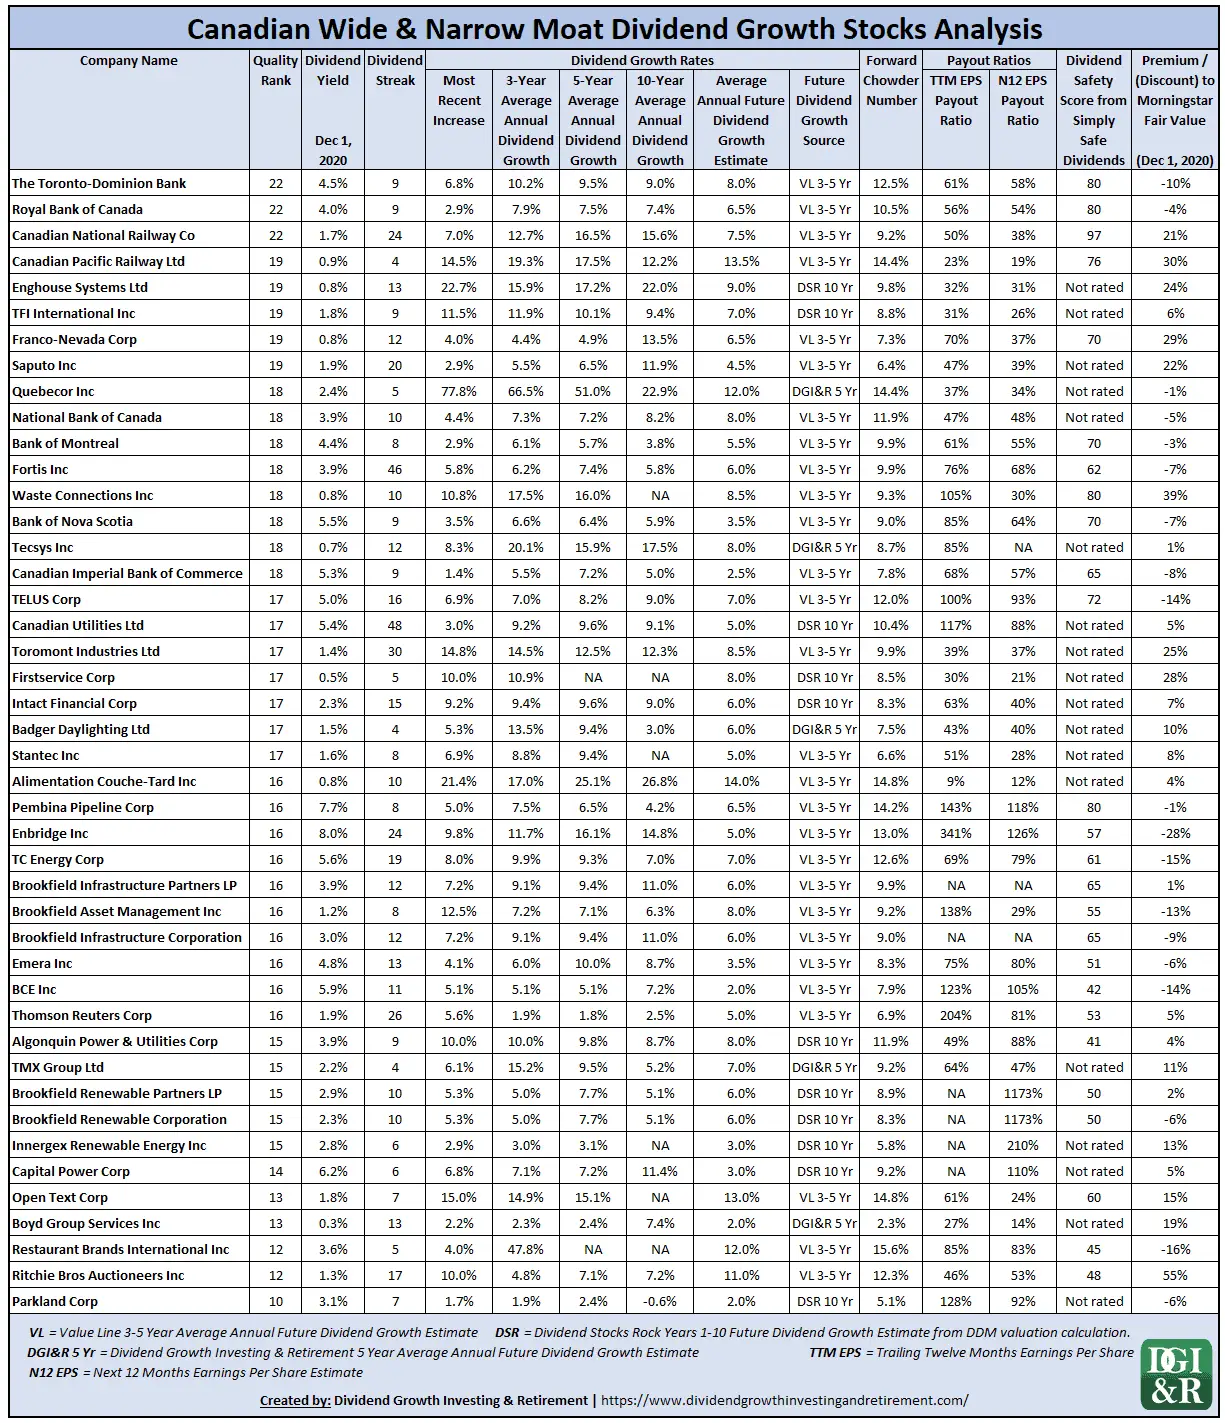
Here’s some more dividend and valuation information for these 44 stocks. They are sorted by Quality Score with the Forward Chowder Number used as a tie-breaker.
Below, I’ve also sorted these 44 stocks into 4 categories and added some dividend and valuation information to make it a bit more manageable to analyze.
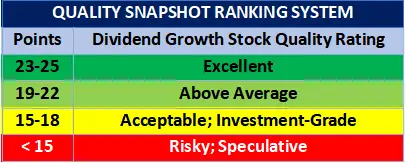
- Excellent Quality (23-25 Points) – 0 Stocks
- Above Average Quality (19-22 Points) – 8 Stocks
- Acceptable or Investment-Grade Quality (15-18 Points) – 30 Stocks
- Risky or Speculative Quality (0-14 Points) – 6 Stocks
Excellent Quality (23-25 Points) – 0 Canadian Wide & Narrow Moat Dividend Growth Stocks
I thought there’d be at least one excellent quality Canadian stock, but none, nada, zero, zilch. You get the idea…
Why no excellent quality Canadian stocks?
The main reason seems to be that no Canadian stock had an “A+“ or “A++” grade from Value Line.
Because they were unable to break above an “A” grade for Value Line’s Financial Strength grades they lost 2 points right away.
From there it only took one more point before they’d dropped from excellent to above average.
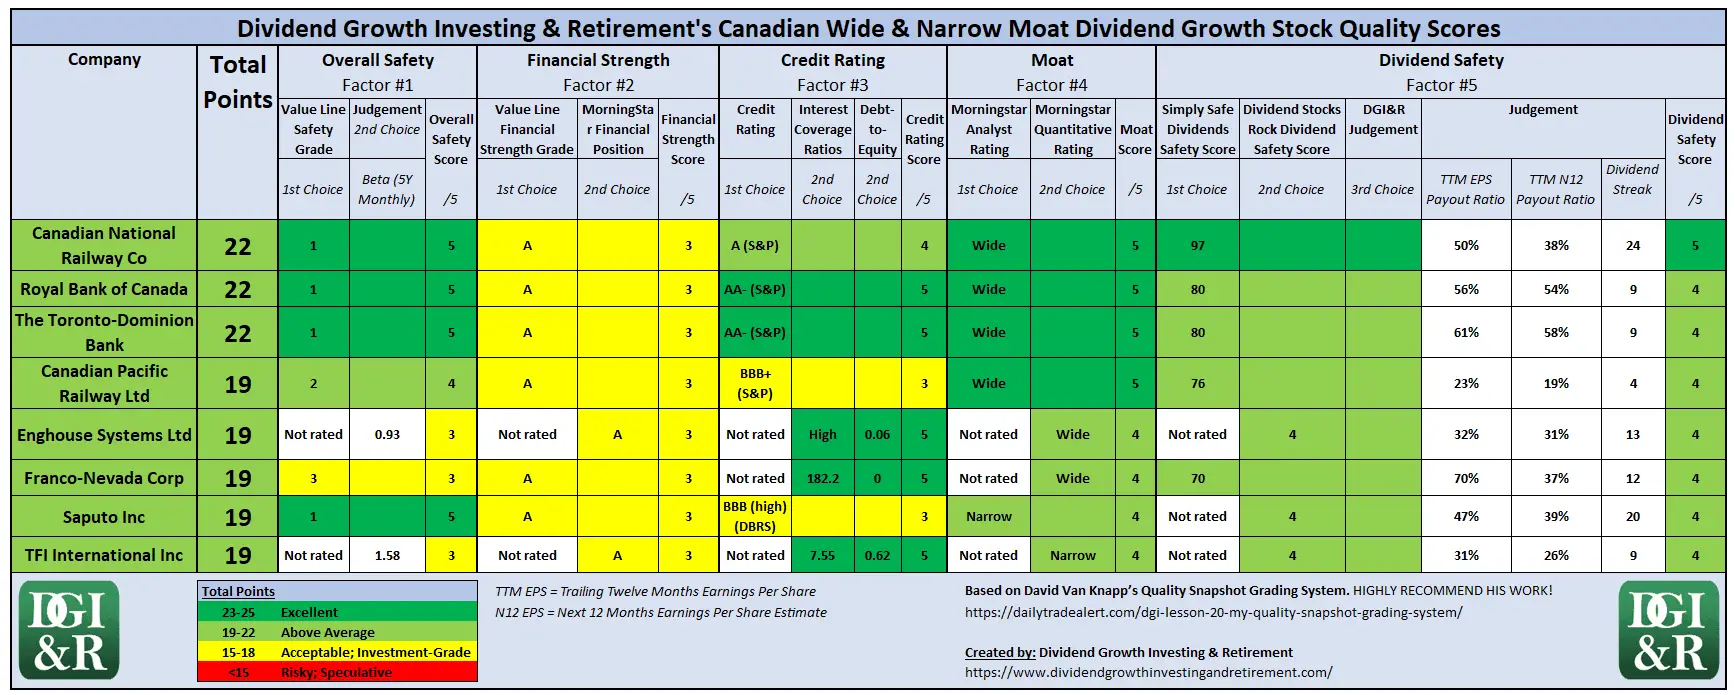
The three closest, with just 1 point short of an excellent quality score, were:
- Canadian National Railway Co (TSE:CNR),
- Royal Bank of Canada (TSE:RY), and
- Toronto-Dominion Bank (TSE:TD).
All 3 scored 22/25.
I went back and looked at some of the US and International excellent quality stocks to see if Canada had comparable companies.
From my earlier wide moat articles, there were:
- 30 excellent quality US wide moat dividend growth stocks, and
- 9 excellent quality International wide moat dividend growth stocks.
Some of the US excellent quality dividend growth stocks were highly recognizable names like: Johnson & Johnson, Microsoft, Nike, Visa, Procter & Gamble, etc.
On the International side you had companies like Nestle with a 25/25 quality score.
It’s hard to compare these internationally well-known stocks and brands to the Canadian stock market.
Yes we have the Canadian banks which are high-quality, but it’s not the same.
It just makes you realize the importance of diversifying outside of Canada so you can invest in some of these other high quality companies.
Above Average Quality (19-22 Points) – 8 Canadian Wide & Narrow Moat Dividend Growth Stocks
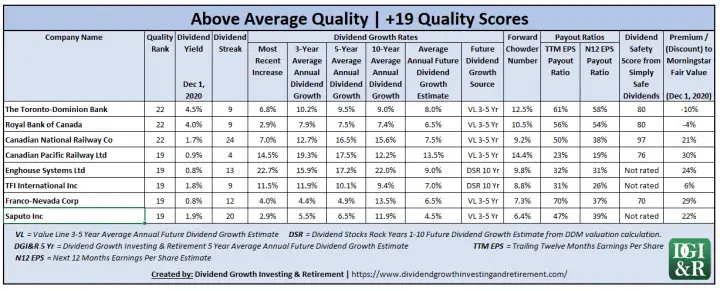
Some Interesting Names to Focus On
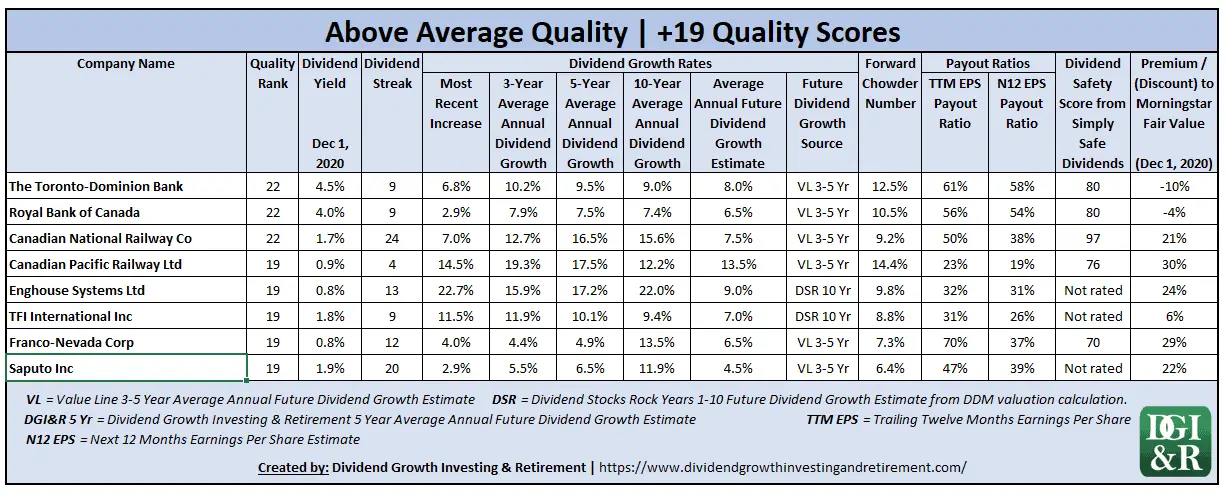
Looking at the list, there was one stock that stood out the most.
The Toronto-Dominion Bank (TSE:TD)
TD bank is the most undervalued and highest yielding of the above average quality stocks.
Value Line is estimating an impressive 8% dividend growth over the next 3-5 years, but I’m a bit skeptical of this.
The OFSI banned share buybacks and dividend increases for Canadian financial institutions back in March because they wanted to make sure the banks had enough capital on hand to weather the COVID-19 recession.
The comments coming from the OFSI in November 2020 make it sound like this ban will remain in place until late 2021. As a result, I wouldn’t expect dividend increases from any of the Canadian banks until the last quarter of 2021.
Even knowing this, TD still looks the most interesting to me of the bunch.
Acceptable or Investment-Grade Quality (15-18 Points) – 30 Canadian Wide & Narrow Moat Dividend Growth Stocks
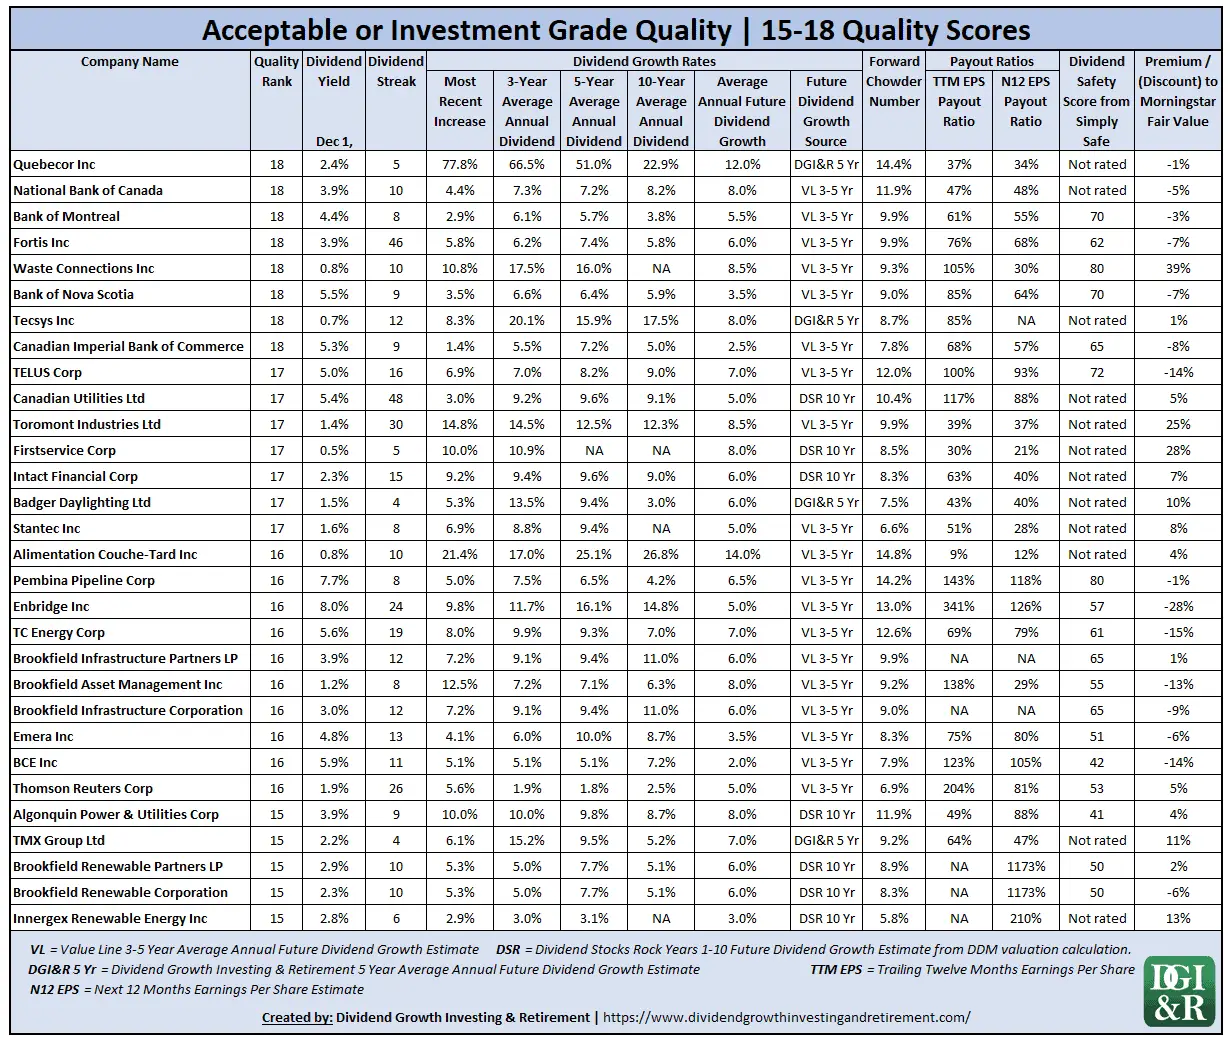
Some Interesting Names to Focus On
Anything in this acceptable or investment-grade quality category should be looked at cautiously, and if possible I’d try to focus more on the higher quality score names.
Sticking to the higher quality scores of 17 or 18 in this category there are currently 7 undervalued:
- Bank of Montreal
- Bank of Nova Scotia
- CIBC
- Fortis
- National Bank of Canada
- Quebecor
- Telus
Telus (TSE:T)
Telus is the most undervalued and it offers a nice mix of yield (5%) and future dividend growth (7%).
Telus jumped out at me more than the banks in this category as the higher quality (22/25) TD bank looks more appealing than the 4 acceptable quality banks (Bank of Montreal, Bank of Nova Scotia, CIBC, and National Bank of Canada).
Fortis (TSE:FTS)
Fortis also caught my attention.
If you are looking for reliable income at a reasonable price, Fortis could fit well.
The yield is almost 4% and they are targeting 6% annual dividend growth to 2025. I believe they’ll hit their target too.
They have the 2nd longest dividend streak in Canada with 46 consecutive years of dividend growth. How’s that for reliable?
Algonquin Power & Utilities (TSE:AQN)
If you are willing to accept a lower quality score of 15, Algonquin Power & Utilities is the other utility that stood out to me.
It has the highest future dividend growth estimate (8%) of all the utility stocks covered in this article.
It’s trading around fair value, and has a 3.9% yield.
Algonquin offers a good mix of yield and dividend growth, but unlike some other utilities (Fortis, Emera, etc.) that have +90% regulated utilities, Algonquin only has about 65% regulated utilities. The remaining ~35% comes from non-regulated renewables.
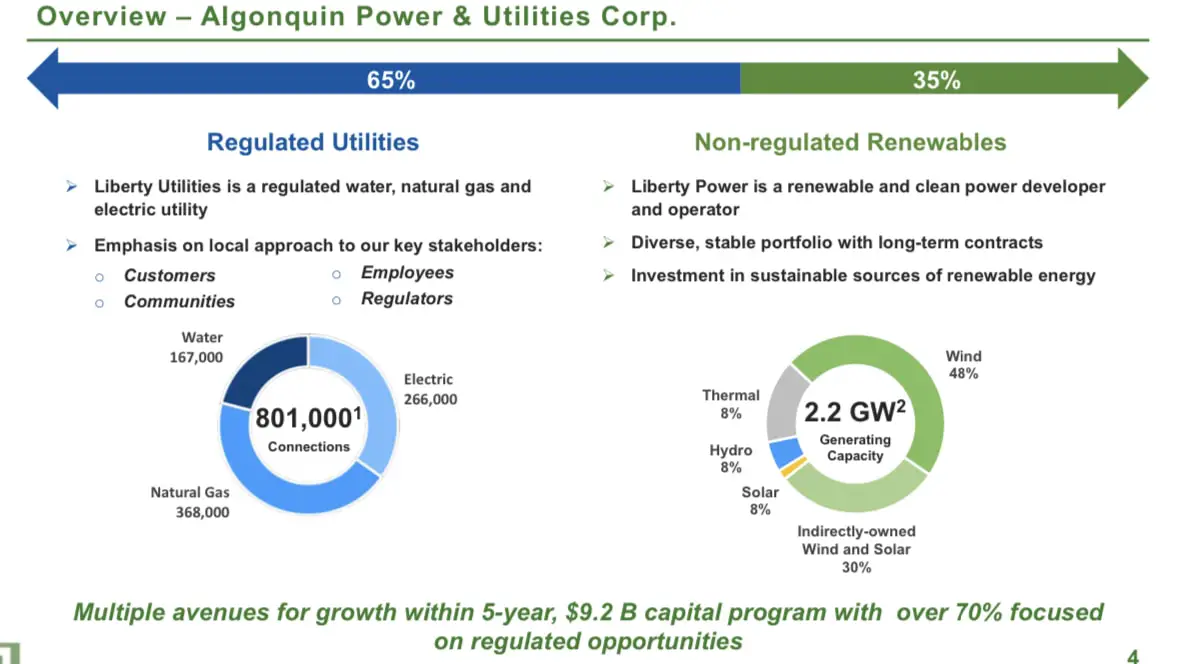
Source: Investor Presentation December 2019
Quebecor (TSE:QBR.B)
Quebecor has a lower yield than the others I’ve mentioned so far and it’s dividend streak is short at 5 years, but this could be one to watch.
They’ve had some enormous dividend increases over the past few years. I wouldn’t expect quite the same level of dividend increases going forward, but it’s their plan to gradually work up to a 30-50% free cash flows from continuing operations payout ratio.
Source: 2019 Annual Information Form
While they work up to this payout target I expect dividend increases to be high.
Currently the short dividend growth streak of 5 years is keeping me from investing. I usually want 10+ years of consecutive dividend increases.
They have a history of raising the dividend for a few years then holding it steady then increasing again. With this newer dividend policy of 30-50% of FCF I’m wondering if they’ve shifted to a more reliable dividend growth every year plan. Time will tell.
Ultimately, Quebecor hasn’t really been on my radar so it’s one I plan to look into more.
Enbridge (TSE:ENB), Pembina Pipeline (TSE:PPL), and TC Energy (TSE:TRP)
The 3 pipelines, Enbridge, Pembina, and TC Energy also caught my attention as they all offer high yields with reasonable future dividend growth estimates.
All 3 are undervalued according to Morningstar and have the same quality score of 16.
Risky or Speculative Quality (0-14 Points) – 6 Canadian Wide & Narrow Moat Dividend Growth Stocks
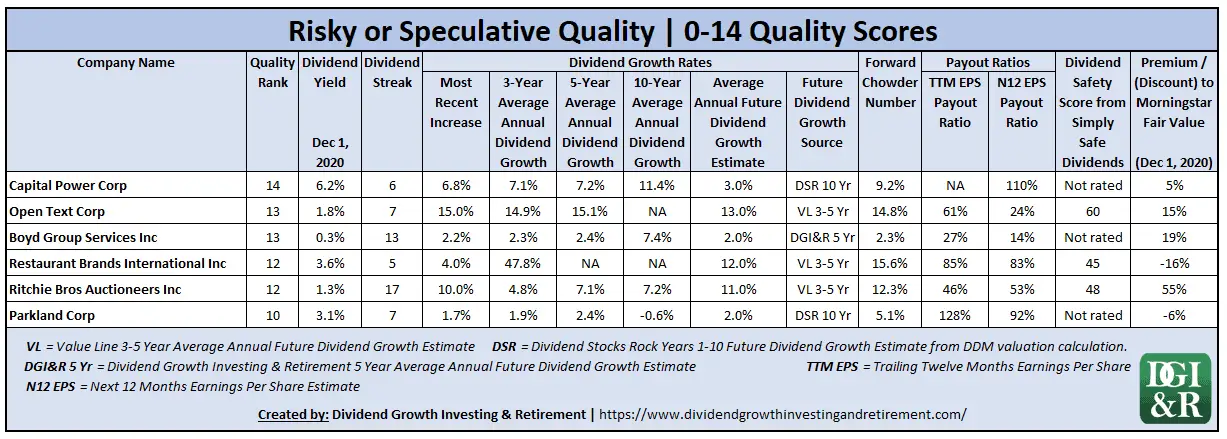
Some Interesting Names to Focus On
These are the worst of the bunch, spend your time focusing on better options.
I was a bit surprised to see Ritchie Bros Auctioneers (TSE:RBA) and Restaurant Brands International (TSE:QSR) on this list, but they don’t have investment grade credit ratings, so I shouldn’t be too surprised.
I think others will be surprised by Open Text (TSE:OTEX) or Boyd Group Services (TSE:BYD) too, but again it’s the non-investment grade credit ratings that sink these companies.
Screening Results
To narrow the results down a bit I ran various screens so I thought I’d share these results too.
Think of these as quick lists to continue your research.
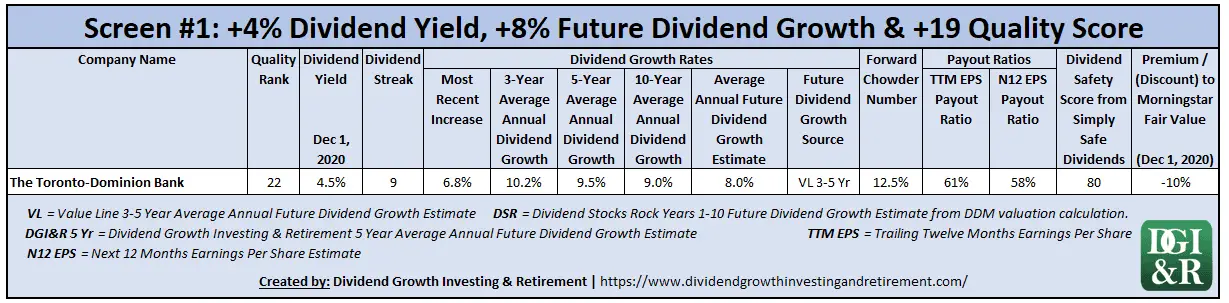
Screen #1 High Future Dividend Growth Estimate (>=8%). High Yield (>=4%). Above Average Quality (>=19)
Screening criteria:
- High Future Dividend Growth Estimate
- >=8% average annual future dividend growth estimate.
- High Yield
- >=4%.
- Above Average Quality
- >=19 quality score.
Results:
- Toronto-Dominion Bank
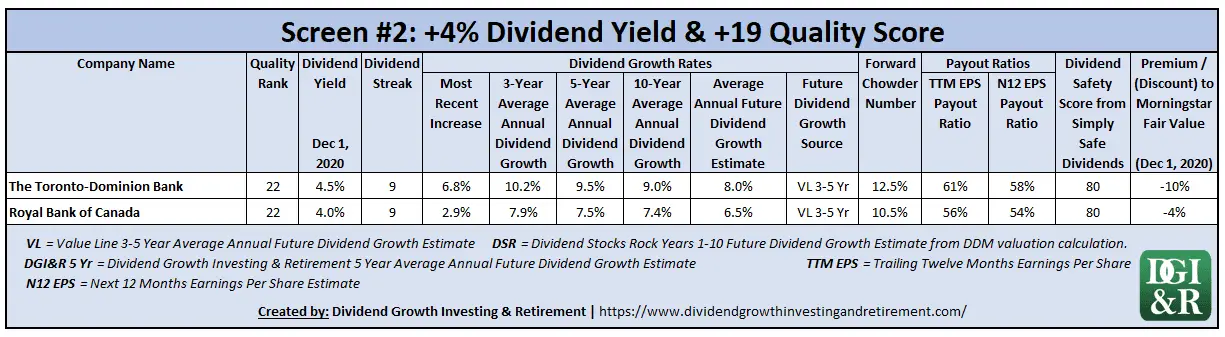
Screen #2 High Yield (>=4%). Above Average Quality (>=19)
Screening criteria:
- High Yield
- >=4%.
- Above Average Quality
- >=19 quality score.
Results:
- Toronto-Dominion Bank
- Royal Bank of Canada
Screen #3 High Future Dividend Growth Estimate (>=10%). TSX Market Yield (>=3%). Average/Investment Grade Quality (>=15)
Screening criteria:
- High Future Dividend Growth Estimate
- >=10% average annual future dividend growth estimate.
- Moderately High Yield
- >=3%. I picked 3% as it’s roughly what the TSX is currently yielding.
- Average/Investment Grade Quality
- >=15 quality score.
Results:
- None.
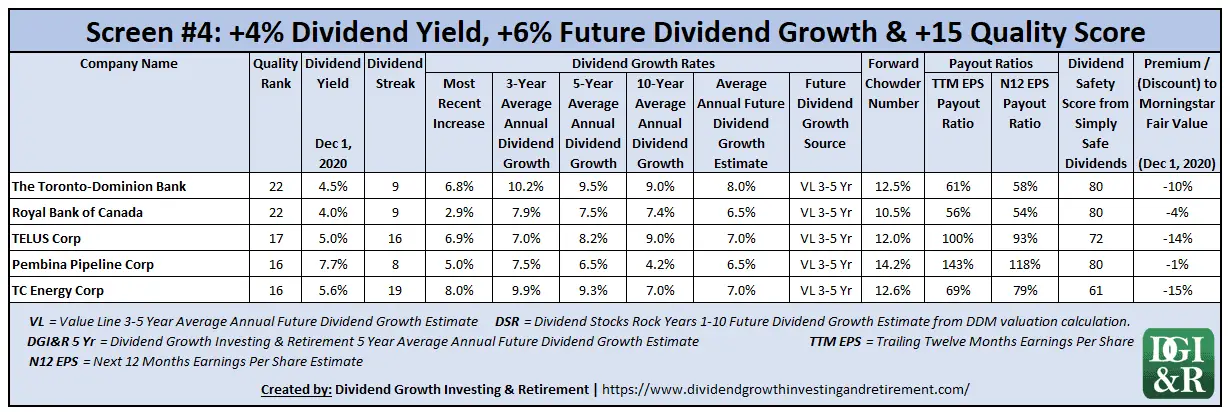
Screen #4 – Reasonable Future Dividend Growth Estimate (>=6%). High Yield (>=4%). Average/Investment Grade Quality (>=15)
Screening criteria:
- Reasonable Future Dividend Growth Estimate
- >=6% average annual future dividend growth estimate.
- High Yield
- >=4%.
- Average/Investment Grade Quality
- >=15 quality score.
Results:
- Toronto-Dominion Bank
- Royal Bank of Canada
- Telus
- Pembina Pipeline
- TC Energy
Screen #5 – Passes Chowder Rule (Yield + Future Dividend Growth >= 12%). Average/Investment Grade Quality (>=15)
The concept behind the chowder rule is that you want a combination of yield and dividend growth.
So if the yield is low you want higher dividend growth and if the yield is high you’d be willing to accept a more moderate dividend growth rate.
Sure Dividend does a good job explaining it:
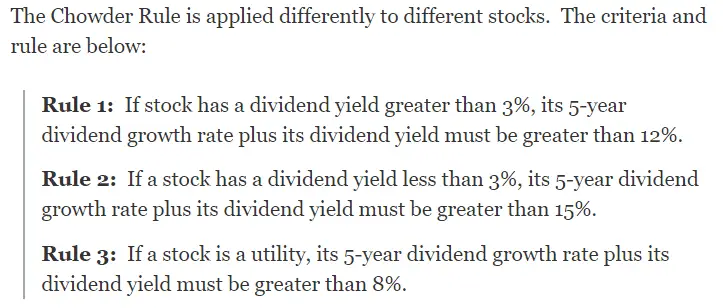
Source: https://www.suredividend.com/the-chowder-rule-explained/
The threshold for utilities is lower because utilities are thought to have more reliable income streams.
The Chowder Rule is normally a backwards looking measure as it uses the historic 5-year dividend growth rate + current dividend yield.
I like to use future dividend growth estimates instead of the past dividend growth rate to weed out any stocks that might be slowing future dividend growth.
I used long term dividend growth estimates from Value Line, Dividend Stocks Rock, and myself (DGI&R) to calculate future chowder number scores.
Here are the results:
High Yield – Chowder Rule 1 Results: Dividend Yield >=3%. Yield + Future Dividend Growth >= 12%. Average/Investment Grade Quality >=15.

Low Yield – Chowder Rule 2 Results: Dividend Yield <3%. Yield + Future Dividend Growth >= 15%. Average/Investment Grade Quality >=15.
- None.
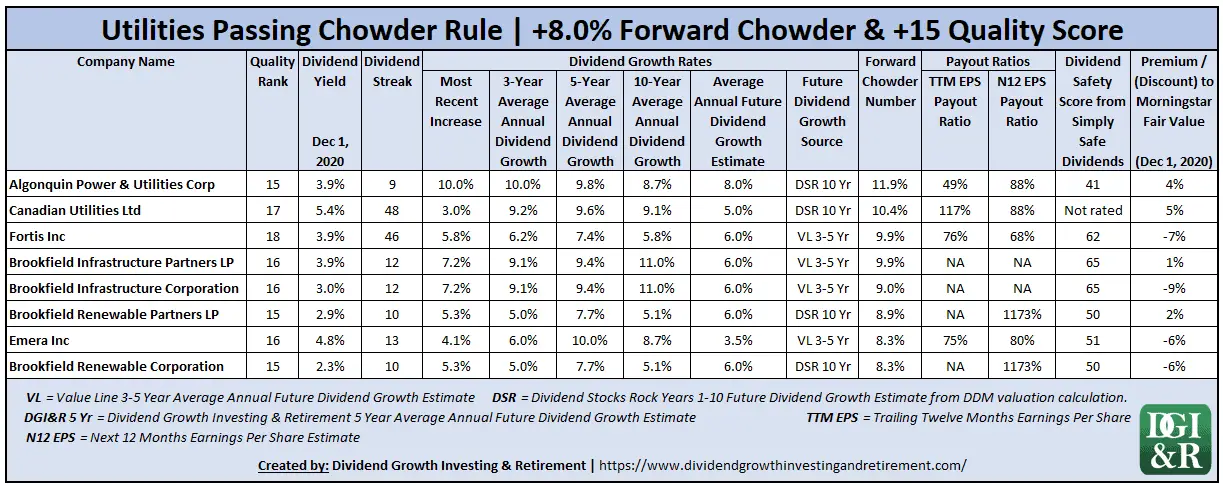
Utilities – Chowder Rule 3 Results: Yield + Future Dividend Growth >=8%. Average/Investment Grade Quality >=15.
Bonus: 2 Additional Resources
Besides the other articles in my wide moat series, here are two additional resources you might find helpful.
1. Canadian Dividend All-Star List (CDASL)
A long dividend streak doesn’t necessarily mean the company has a wide or narrow moat, but it can be an indication of a high-quality company.
The Canadian Dividend All-Star List (CDASL) is a free excel spreadsheet that I email to my subscribers at the beginning of every month. It contains stock information on Canadian companies that have increased their dividend for 5+ years in a row.
Download CDASL
Subscribe to the Dividend Growth Investing & Retirement newsletter and you'll be emailed the download link for the most recent version of the Canadian Dividend All-Star List (CDASL).
2. Morningstar
I used Morningstar’s moat ratings for this article, so check your online broker to see if they provide Morningstar access. Most Canadian brokers provide it free.
For a list of Canadian brokers that provide free Morningstar access as well as some other ways to find wide moat stocks, check out the details in this article: 3 Ways to Find Wide Moat Stocks
Summary
In Canada there are 9 wide moat stocks and 100 narrow moat stocks, but which of these companies with strong sustainable competitive advantages make good dividend growth investments?
To answer this question, I did three things:
- I researched all Canadian wide and narrow moat companies to identify 44 stocks with a 5+ year dividend growth streak.
- I ranked them using a quality scoring system that includes:
- overall safety,
- financial strength,
- credit ratings,
- moat analysis, and
- dividend safety.
- To get a better sense of the best stocks to focus on, I provided additional valuation and dividend metrics like:
- yield,
- dividend streaks,
- dividend growth rates (most recent, 3-year, 5-year, and 10-year averages),
- future dividend growth estimates,
- Chowder Numbers, and
- Morningstar fair value estimates.
Some of the higher quality names that caught my interest were Toronto-Dominion Bank, Telus, and Fortis.
Some of the lower quality, but still acceptable quality stocks that stood out were the 3 pipeline stocks and Algonquin Power & Utilities Corp.
What caught your eye?
Don’t forget to check out the rest of the wide moat articles in this series.
- What is a Moat? With 5 Canadian Wide Moat Examples
- Why Invest in Wide Moat Stocks?
- 3 Ways to Find Wide Moat Stocks
- Each & Every Wide Moat Stock in Canada
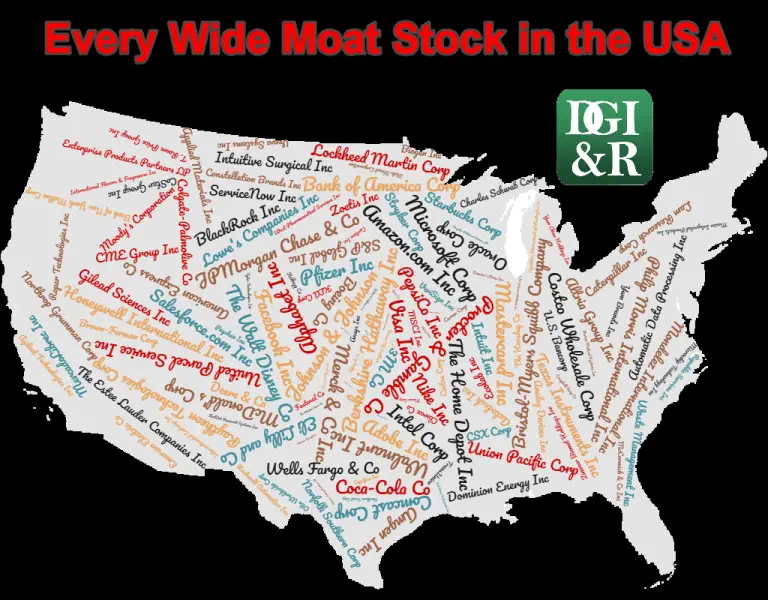
- Every Wide Moat Stock in the USA
- International Wide Moat Stocks – Every Single One Listed
- 8 Canadian Dividend Growth Wide Moat Stocks
- 76 US Wide Moat Dividend Growth Stocks
- 23 International Wide Moat Dividend Growth Stocks
- 100 Canadian Narrow Moat Stocks
- 44 Canadian Wide & Narrow Moat Dividend Growth Stocks (This is the article you just read)
Disclosure: I own shares of Bank of Nova Scotia, Brookfield Infrastructure Partners LP, Canadian Utilities, Emera, Enbridge, National Bank of Canada, Telus, and TD. You can see my portfolio here.
Newsletter Sign-Up & Bonus
Have you enjoyed our content?
Then subscribe to our newsletter and you'll be emailed more great content from Dividend Growth Investing & Retirement (DGI&R).
BONUS: Subscribe today and you'll be emailed the most recent version of the Canadian Dividend All-Star List (CDASL).
The CDASL is an excel spreadsheet with an abundance of useful dividend screening information on Canadian companies that have increased their dividend for five or more years in a row.
The CDASL is one of the most popular resources that DGI&R offers so don't miss out!


Thanks for the article! Excellent as always. I can’t believe Enbridge ranks so low- Their dividend streak is impressive and well covered by DCF, in addition to it currently being undervalued. The ex BOC governor is a member of their BoD, if that means anything! Ha! I’m also a big fan of Telus’ movement and progress thus far within the realms of agriculture, security, and healthcare.. Easily my favourite telecommunication play going forward.
Thanks Trevor. I’m not too surprised by Enbridge. They have debt and DCF payout ratios are less conservative than EPS, FCF or operating cash flow payout ratios. All that said, I own them and bought more of them recently. Be interesting to see what they say in their investor day presentation coming up later this month.
A terrific piece of work A real keeper. Big thank you to all involved.
Thanks Doug!
Quality post as usual.
Thanks for sharing.
Thanks Jordan!
thank you
great list
Thanks Jason!
Well done, detailed and succinct, it would be great to see an update again soon, cheers